In the volatile world of cryptocurrency trading, having the right analytical tools can make the difference between profit and significant loss. The Money Flow Index (MFI) stands out as a powerful momentum oscillator that combines price and volume data to measure buying and selling pressure. Created in the late 1980s by Gene Quong and Avrum Soudack, the MFI was designed to improve upon traditional momentum indicators by incorporating volume, thus providing a more comprehensive view of market strength than the widely used Relative Strength Index (RSI). Often referred to as "volume-weighted RSI," the MFI oscillates between 0 and 100 and is particularly valuable for identifying potential overbought and oversold conditions, as well as spotting divergences that may signal impending trend reversals. For crypto traders navigating markets known for their rapid price swings and heavy reliance on trading volume, the MFI serves as an essential instrument for making informed decisions, validating trends, and optimizing entry and exit points.
What is the Money Flow Index and How It Works?
The Money Flow Index is a technical momentum oscillator that analyzes both price and volume to gauge the intensity of money flowing into and out of an asset. Unlike simple price-based indicators, the MFI's integration of volume data offers a deeper insight into the underlying strength or weakness of a price trend. The core principle behind the MFI is that the level of buying or selling pressure can be assessed by examining the relationship between an asset's typical price and its associated trading volume over a specific period, typically 14 days.
The indicator functions on a scale of 0 to 100. Generally, readings above 80 suggest that an asset may be overbought, indicating excessive buying pressure and a potential price correction. Conversely, readings below 20 suggest that an asset may be oversold, pointing to excessive selling pressure and a potential price bounce. This makes the MFI particularly useful in the crypto market, where asset prices are often driven by sentiment and momentum, helping traders identify when a trend might be exhausting itself.
MFI Calculation Steps
The calculation of the Money Flow Index is a multi-step process that ultimately generates a value between 0 and 100. The standard lookback period is 14 sessions, but this can be adjusted based on a trader's strategy. The steps are as follows:
Calculate the Typical Price (TP): For each period, calculate the average of the high, low, and closing prices.
Calculate the Raw Money Flow (RMF): Multiply the Typical Price by volume for that period.
Determine Positive and Negative Money Flow: Compare each period's Typical Price to the previous period's. If today's Typical Price is higher, the Raw Money Flow is considered positive. If it is lower, the money flow is considered negative.
Calculate the Money Flow Ratio (MFR): Sum all the Positive Money Flows over the 14-period window and divide by the sum of all the Negative Money Flows over the same window.
Calculate the Money Flow Index (MFI): Finally, convert the Money Flow Ratio into an index value.
This formula creates an oscillator that is bounded between 0 and 100, providing a standardized measure of buying and selling pressure.
MFI vs. RSI
While both the Money Flow Index and the
Relative Strength Index (RSI) are momentum oscillators sharing a similar 0-100 scale and overbought/oversold interpretation, their core difference lies in the inclusion of volume data. The RSI is calculated based solely on price changes, measuring the speed and magnitude of recent price movements. In contrast, the MFI incorporates trading volume into its calculation, making it a more comprehensive tool for analyzing market dynamics.
This key distinction means the MFI can often provide earlier or more reliable signals, especially in markets like cryptocurrency, where volume is a critical indicator of conviction behind a price move. For instance, a price increase on low volume might not be confirmed by the MFI, signaling a weak trend, whereas the
RSI might only reflect the price change itself. Consequently, many traders regard the MFI as a "volume-weighted RSI," offering a more robust view of market strength by confirming whether price movements are supported by significant trading activity.
Why the Money Flow Index (MFI) Matters in Crypto?
The cryptocurrency market is characterized by high volatility, strong trend-based momentum, and a significant influence from trader sentiment. In this environment, the MFI is an exceptionally valuable tool for several reasons. First, crypto assets are prone to rapid and often exaggerated price swings. The MFI's ability to identify potential overbought and oversold extremes helps traders avoid the common pitfall of buying at a peak or selling at a trough. When the MFI enters these extreme zones, it suggests that the current buying or selling pressure may have reached an unsustainable level, flagging a potential reversal point.
Second, cryptocurrency trends are often driven and confirmed by trading volume. A rally accompanied by rising volume is seen as more legitimate than one on thin volume. By integrating volume directly into its formula, the MFI provides a built-in mechanism for validating the strength of a price trend. Furthermore, the prevalence of momentum-driven trades in crypto makes divergence analysis, which is a key application of the MFI—particularly powerful. Divergences between price and the MFI can serve as early warning signals of a potential trend reversal, giving attentive traders a strategic edge.
Interpreting MFI Levels
Interpreting the MFI revolves around analyzing its levels and movements within the 0-100 band. The most fundamental signals come from the overbought and oversold thresholds.
-
Overbought (MFI > 80): When the MFI rises above 80, it indicates that the asset may be overbought due to sustained and potentially excessive buying pressure. This is not an automatic sell signal but rather a warning that the asset is becoming overvalued in the short term and that a price pullback or consolidation is increasingly likely.
-
Oversold (MFI < 20): When the MFI falls below 20, it signals that the asset may be oversold due to intense and potentially exhausted selling pressure. This suggests the asset could be undervalued and primed for a potential rebound or price bounce.
It is crucial to understand that during strong trending markets, the MFI can remain in overbought or oversold territory for extended periods. Therefore, a more dynamic approach to interpretation is often necessary. For example, a drop back below 80 after being in the overbought zone can be a more reliable sell signal than the initial breach above it. Similarly, a rally back above 20 from the oversold zone can confirm a buy signal. The 50 level is also sometimes used as a midpoint; a move above 50 can signal strengthening buying momentum, while a drop below 50 can signal increasing selling pressure.
Divergence Signals
One of the most powerful applications of the MFI is the identification of divergences, which occur when the price of an asset moves in the opposite direction of the MFI. Divergences often signal a weakening trend and a potential reversal.
-
Bearish Divergence: This occurs when the price of an asset makes a higher high, but the MFI forms a lower high. This indicates that while the price is still climbing, the underlying buying pressure is diminishing. It suggests that the upward trend is losing momentum and a downward reversal may be imminent.
-
Bullish Divergence: This occurs when the price of an asset makes a lower low, but the MFI forms a higher low. This signals that despite the price falling, the selling pressure is waning. It implies that the downward trend is exhausting itself, and an upward reversal could be on the horizon.
Divergences are considered stronger signals when they occur in overbought or oversold territories. However, they should not be used in isolation, as a divergence alone does not guarantee a reversal; it merely warns of a potential change in momentum.
Using MFI to Identify Entry and Exit Points
Traders can incorporate the MFI into their strategies to identify potential entry and exit points, though it is always recommended to use it in conjunction with other tools.
-
Potential Entry Signals:
-
A primary signal is when the MFI moves out of the oversold zone, crossing back above the 20 level, potentially indicating the start of a new upward momentum.
-
A bullish divergence, where price makes a new low but the MFI makes a higher low, can also serve as a potential entry signal, especially if it is confirmed by a bullish candlestick pattern or support from a moving average.
-
Potential Exit Signals:
-
Conversely, a potential exit or short signal occurs when the MFI falls from the overbought zone, crossing back below the 80 level.
-
A bearish divergence, where price makes a new high but the MFI makes a lower high, is a strong warning sign to consider taking profits or preparing to exit a long position.
Another advanced concept is the "failure swing." A bearish failure swing happens when the MFI peaks above 80, retraces, and then fails to surpass its previous high on the next rally. A bullish failure swing occurs when the MFI bottoms below 20, bounces, and then holds above its previous low on the next pullback. These patterns can signal reversals independent of the price action itself.
Case Analysis: ETH Token and the Money Flow Index (MFI)
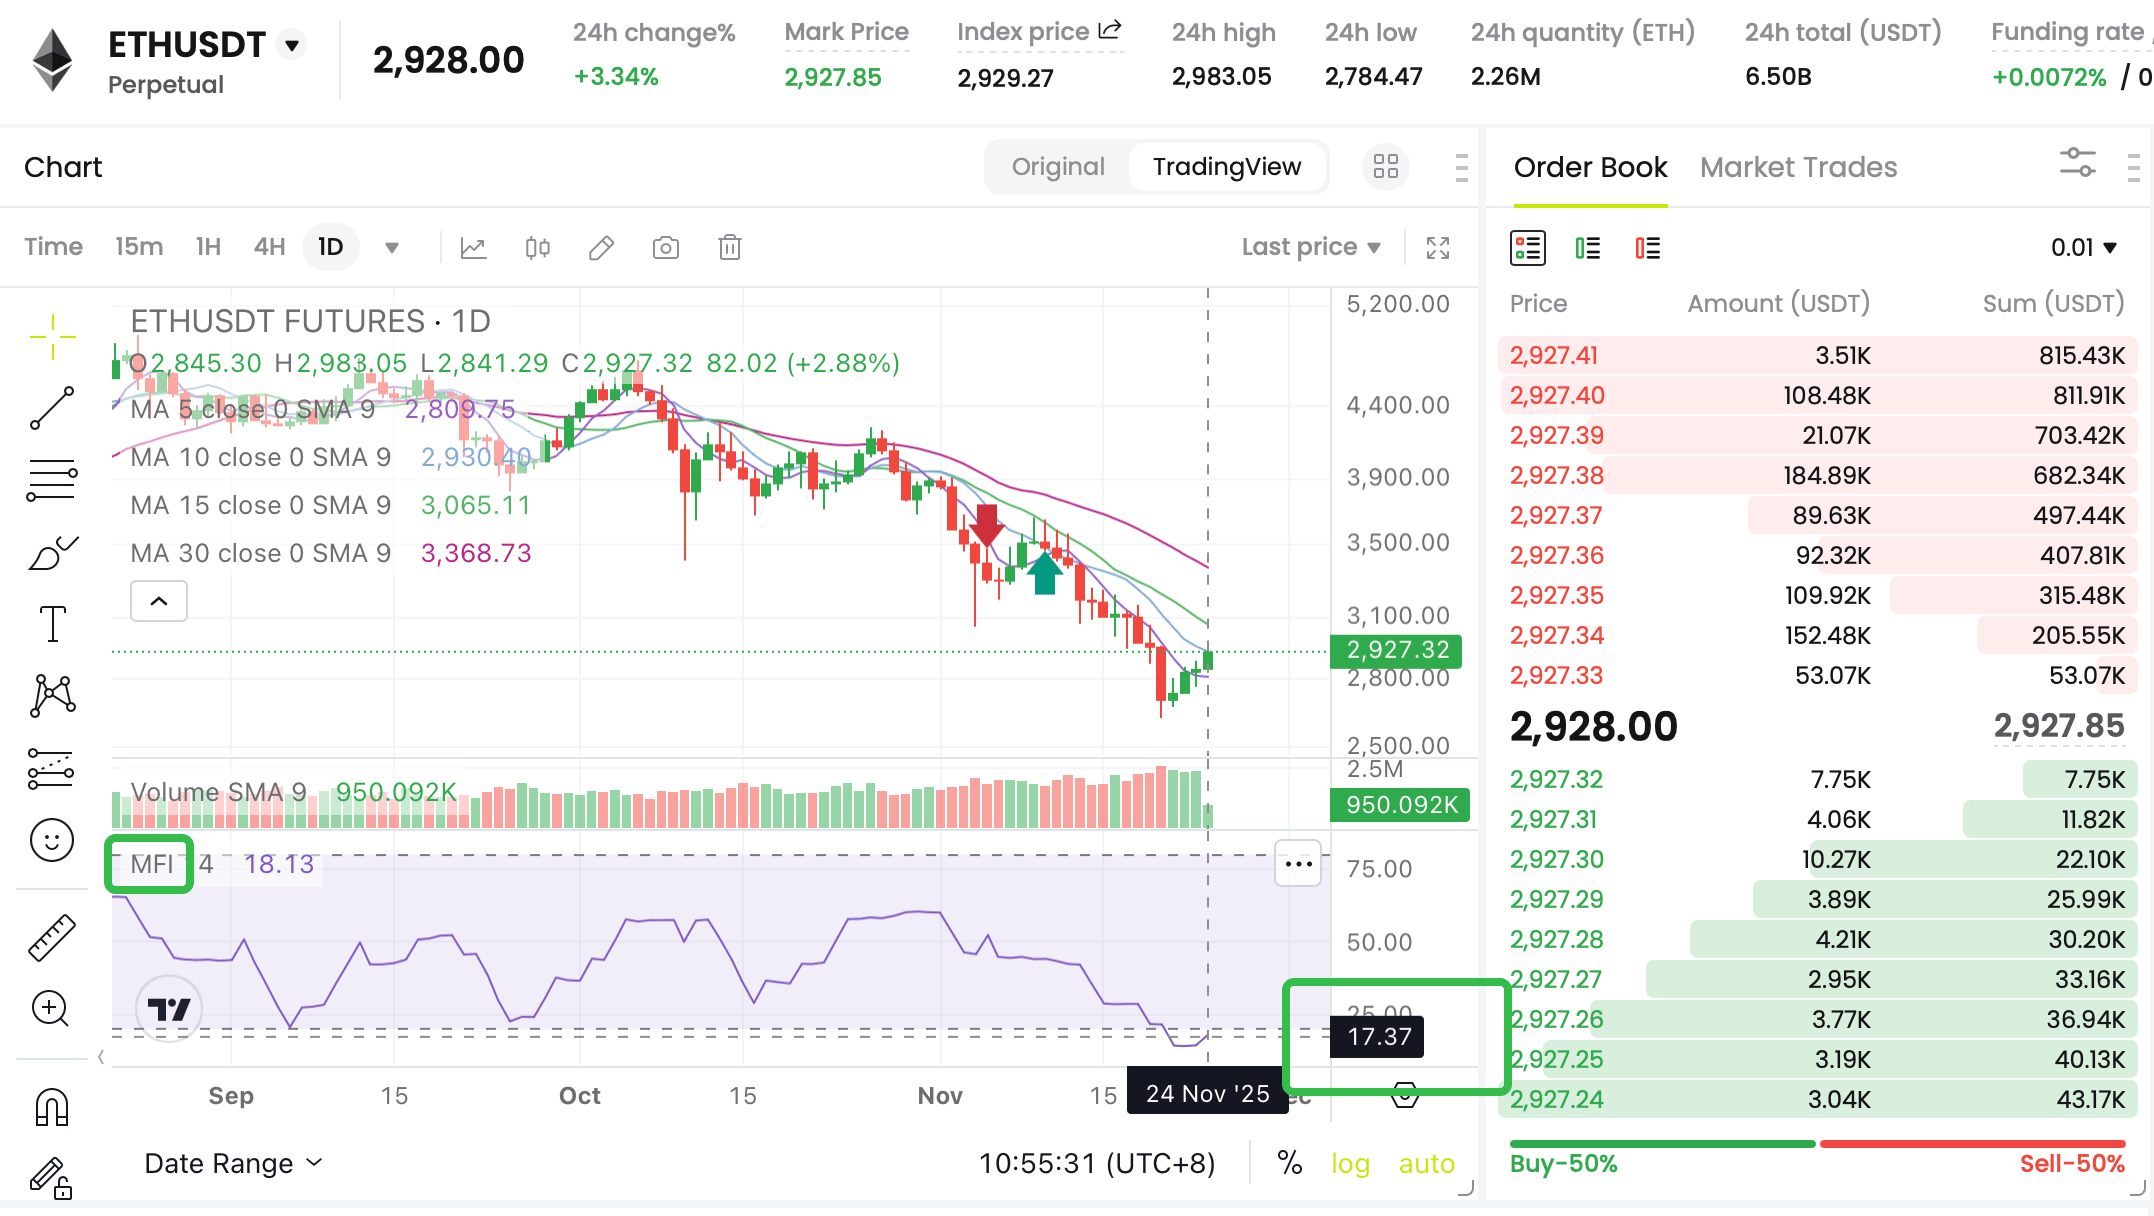
Consider a hypothetical scenario with Ethereum (ETH) during a strong bearish run. The price has been declining for weeks, and optimism is low.
Market Snapshot:
Timeframe: 1-day chart
MFI Reading: 17
Price Movement: A consistant downtrend with decreasing volume
An MFI reading below 20 is typically considered oversold. Given that ETH is in a pronounced downtrend and testing major support, traders would watch for the MFI to move back above 20 as a potential early signal that selling pressure is exhausting and a bounce could be imminent
For Aggressive Traders:
Thought: Treat MFI=17 as a short-term rebound test signal.
Action: Consider looking for entry opportunities to go long near the key support area of $2,720.
Risk Control: Always set a stop-loss, for example, below $2,700, to prevent a larger drop if support fails.
For Conservative Traders:
Thought: Don't rush into the market; wait for more trend confirmation signals.
Action: Wait for the MFI indicator to rebound from the oversold zone (e.g., back above 30), while observing whether the price can effectively break through the resistance level near $2,890. Consider entering the market after a confirmation signal appears; the success rate will be higher.
Advantages and Limitations of the MFI in Crypto
Advantages:
-
Volume Integration: The primary advantage of the MFI is its combination of price and volume, offering a more nuanced view of market momentum than volume-less indicators like RSI.
-
Effective in Volatile Markets: The MFI is well-suited for the high-volatility crypto market, as it helps to filter out noise and identify potential exhaustion points in strong trends.
-
Powerful Divergence Signals: Divergences between MFI and price can provide high-probability early warning signals for trend reversals.
Limitations:
-
False Signals in Trending Markets: In strongly trending markets, the MFI can remain in overbought or oversold territory for long periods, generating premature reversal signals.
-
Lagging Nature: As a calculated oscillator based on past data, the MFI is inherently lagging and may not predict sudden, news-driven market moves.
-
Not a Standalone Tool: The MFI should not be used in isolation. Its signals require confirmation from other technical indicators, price action patterns, or fundamental analysis to improve reliability.
Tips for Applying MFI in Crypto Trading
To effectively use the Money Flow Index in cryptocurrency trading, traders should consider the following tips:
Combine with Other Indicators: Use the MFI alongside other tools like moving averages, trend lines, or the MACD to confirm signals. For example, a buy signal from the MFI is stronger if it aligns with a bounce off a key moving average support.
Adjust the Timeframe: While the 14-period is standard, experimenting with different timeframes (e.g., a shorter period for more sensitive signals or a longer period for smoother, more reliable signals) can tailor the indicator to your trading style.
Prioritize Divergences: Pay close attention to bullish and bearish divergences, as they are often among the most reliable signals the MFI produces.
Analyze Multiple Timeframes: Confirm signals by looking at the MFI on different timeframes. A bullish signal on the 4-hour chart that is also supported by the daily chart carries more weight.
Consider Overall Market Context: Always assess the broader market sentiment and news flow. A bearish MFI divergence during a period of positive market-wide news may be less likely to immediately play out.
Conclusion
The Money Flow Index is a sophisticated yet accessible tool that provides crypto traders with a deeper understanding of market dynamics by merging price and volume analysis. Its ability to identify overbought and oversold conditions, coupled with the powerful predictive potential of divergence signals, makes it an indispensable part of a modern trader's toolkit. While it is not without its limitations, such as generating false signals during strong trends, its utility is greatly enhanced when used in conjunction with other forms of technical and fundamental analysis . In the fast-paced and often unpredictable cryptocurrency markets, the MFI offers a data-driven method to gauge buying and selling pressure, validate trends, and make more informed trading decisions. By mastering the interpretation of the Money Flow Index, traders can navigate market volatility with greater confidence and precision.