The RSI, which stands for Relative Strength Index, is recognized as one of the most widely used momentum oscillators. Its popularity among professional traders stems from its ability to effectively indicate the speed of an asset's price movement. This indicator is utilized by cryptocurrency traders and is considered one of the premier technical indicators in both cryptocurrency trading and various other financial trading arenas.
When novice traders embark on their journey to understand technical analysis, they often choose to begin their education with this particular indicator. The dependable indicator assesses an asset's momentum and reveals whether the market price is overbought or oversold. This indicator can be employed to develop a successful trading strategy.
The subsequent guide will provide you with all the essential information regarding the RSI and its application in cryptocurrency trading with CoinCatch.
What Is RSI (Relative Strength Index)?
Many cryptocurrency traders depend on technical analysis to forecast future price fluctuations. They conduct this analysis utilizing various types of technical indicators that are available in the market. In addition to news and economic data, the prices of financial assets, which include forex, commodities, stocks, bonds, and cryptocurrencies, are influenced by market trends.
The Relative Strength Index, or RSI, is a momentum oscillator that measures the speed and change of price movements. Developed by J. Welles Wilder Jr, the RSI was introduced in his book New Concepts in Technical Trading Systems in 1978.
The RSI is displayed as an oscillator that is visible on a separate window of the chart. The indicator is bound between 0 and 100 and assists traders by raising awareness that an asset is potentially trading in overvalued or undervalued territory based on recent price movements.
Think of the RSI as a speedometer for a stock or asset. It helps market participants see how quickly the price is changing and how the average gains compare to the average losses.
How to Apply RSI Indicator to CoinCatch Charts
Here's how you can add the RSI to the chart on the CoinCatch Trading page.
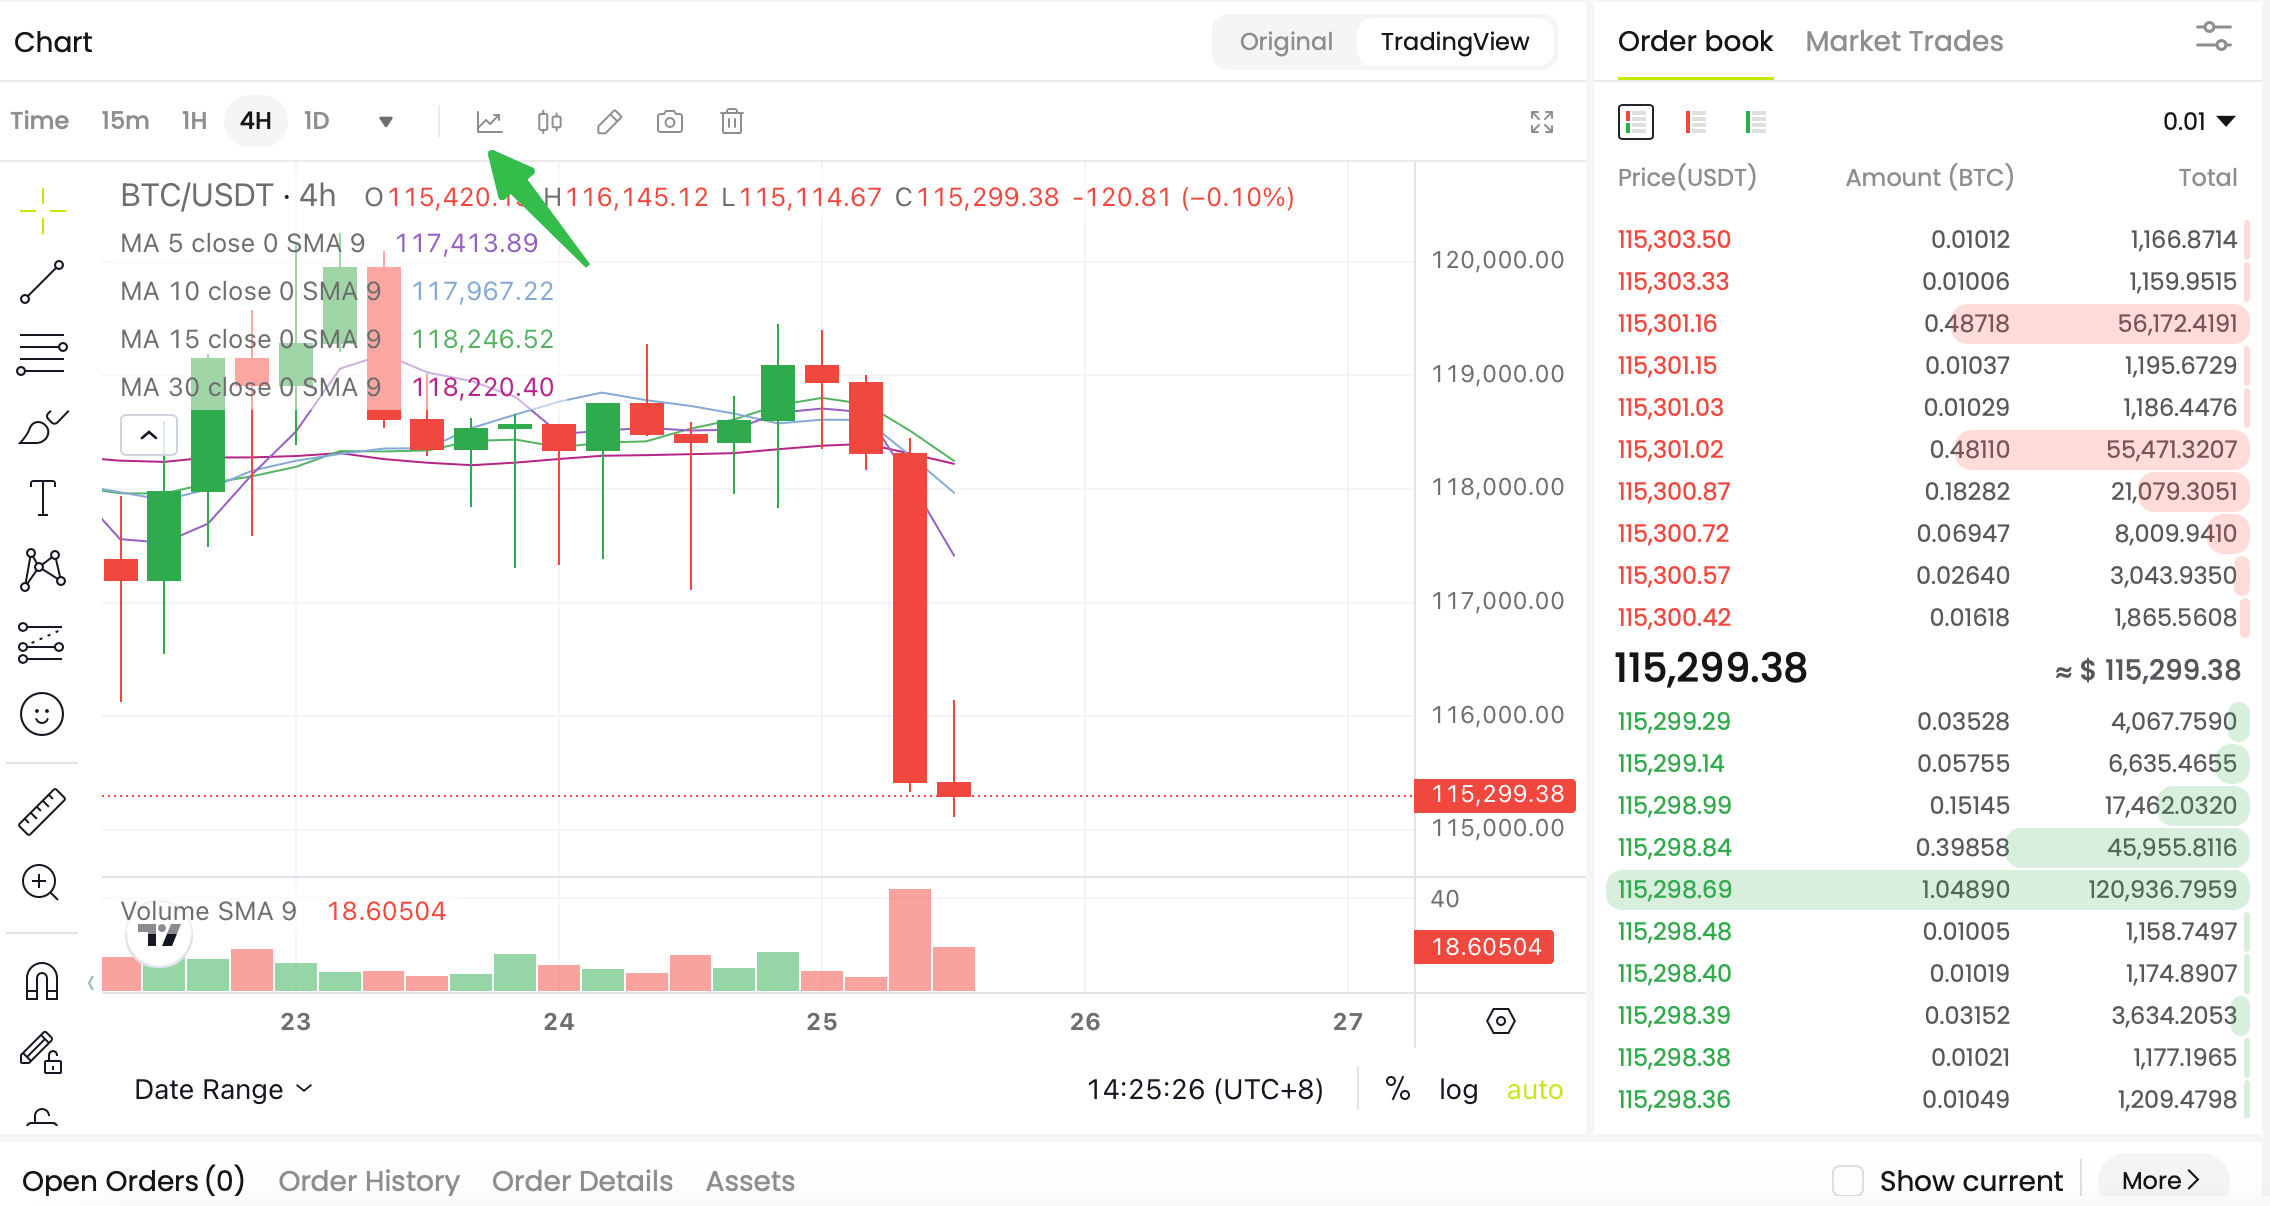
Step 1: Choose Indicators
Choose an indicator from the options in the chart below.
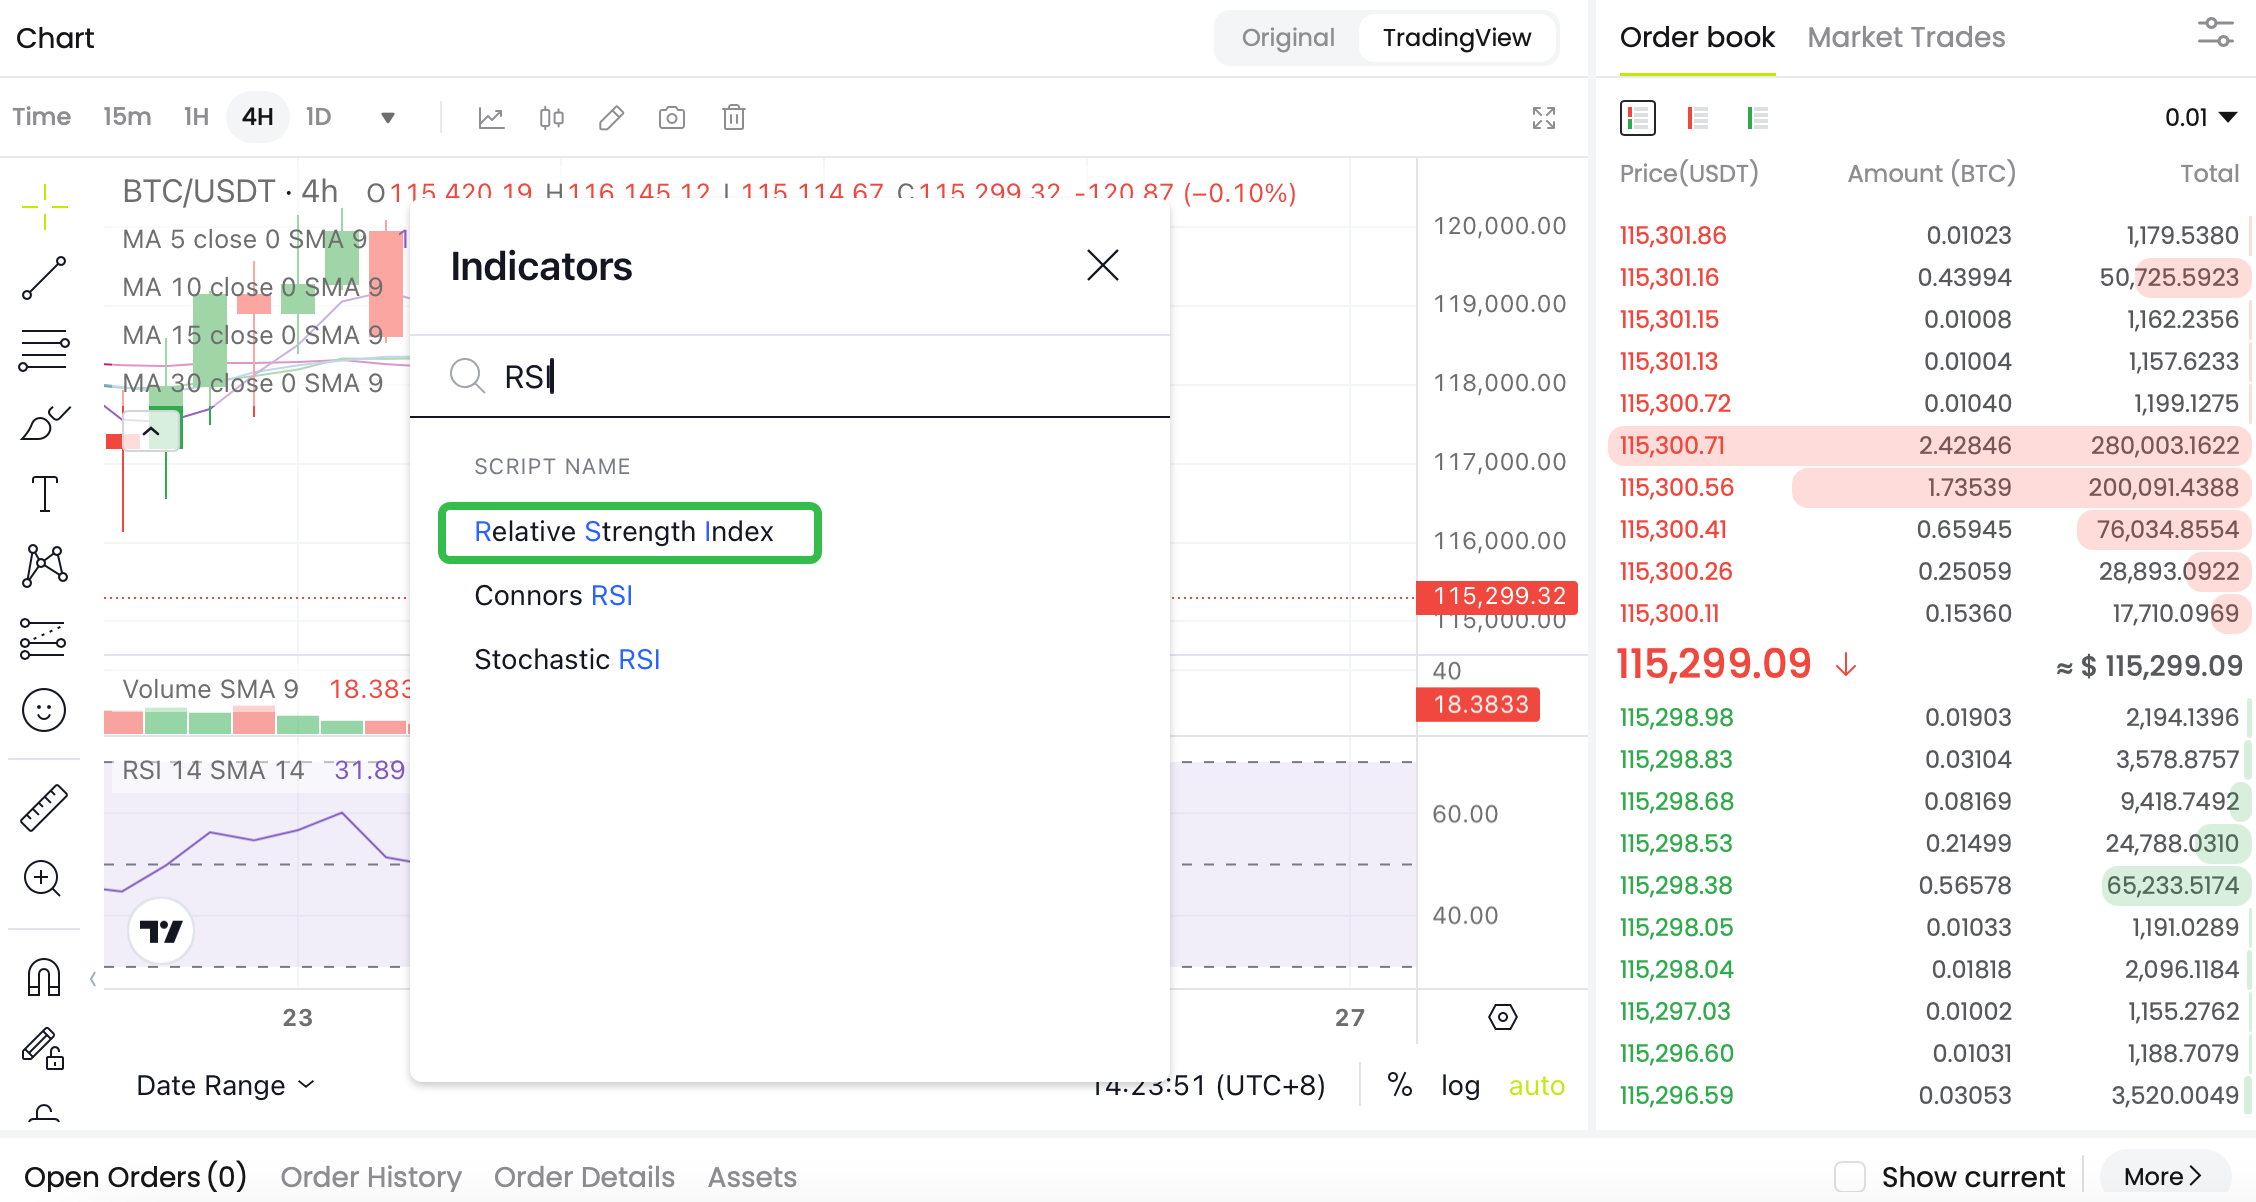
Step 2: Search For RSI Indicator
Type Relative Strength Index in the search bar, and the RSI indicator will appear on a list of indicators in the search list.
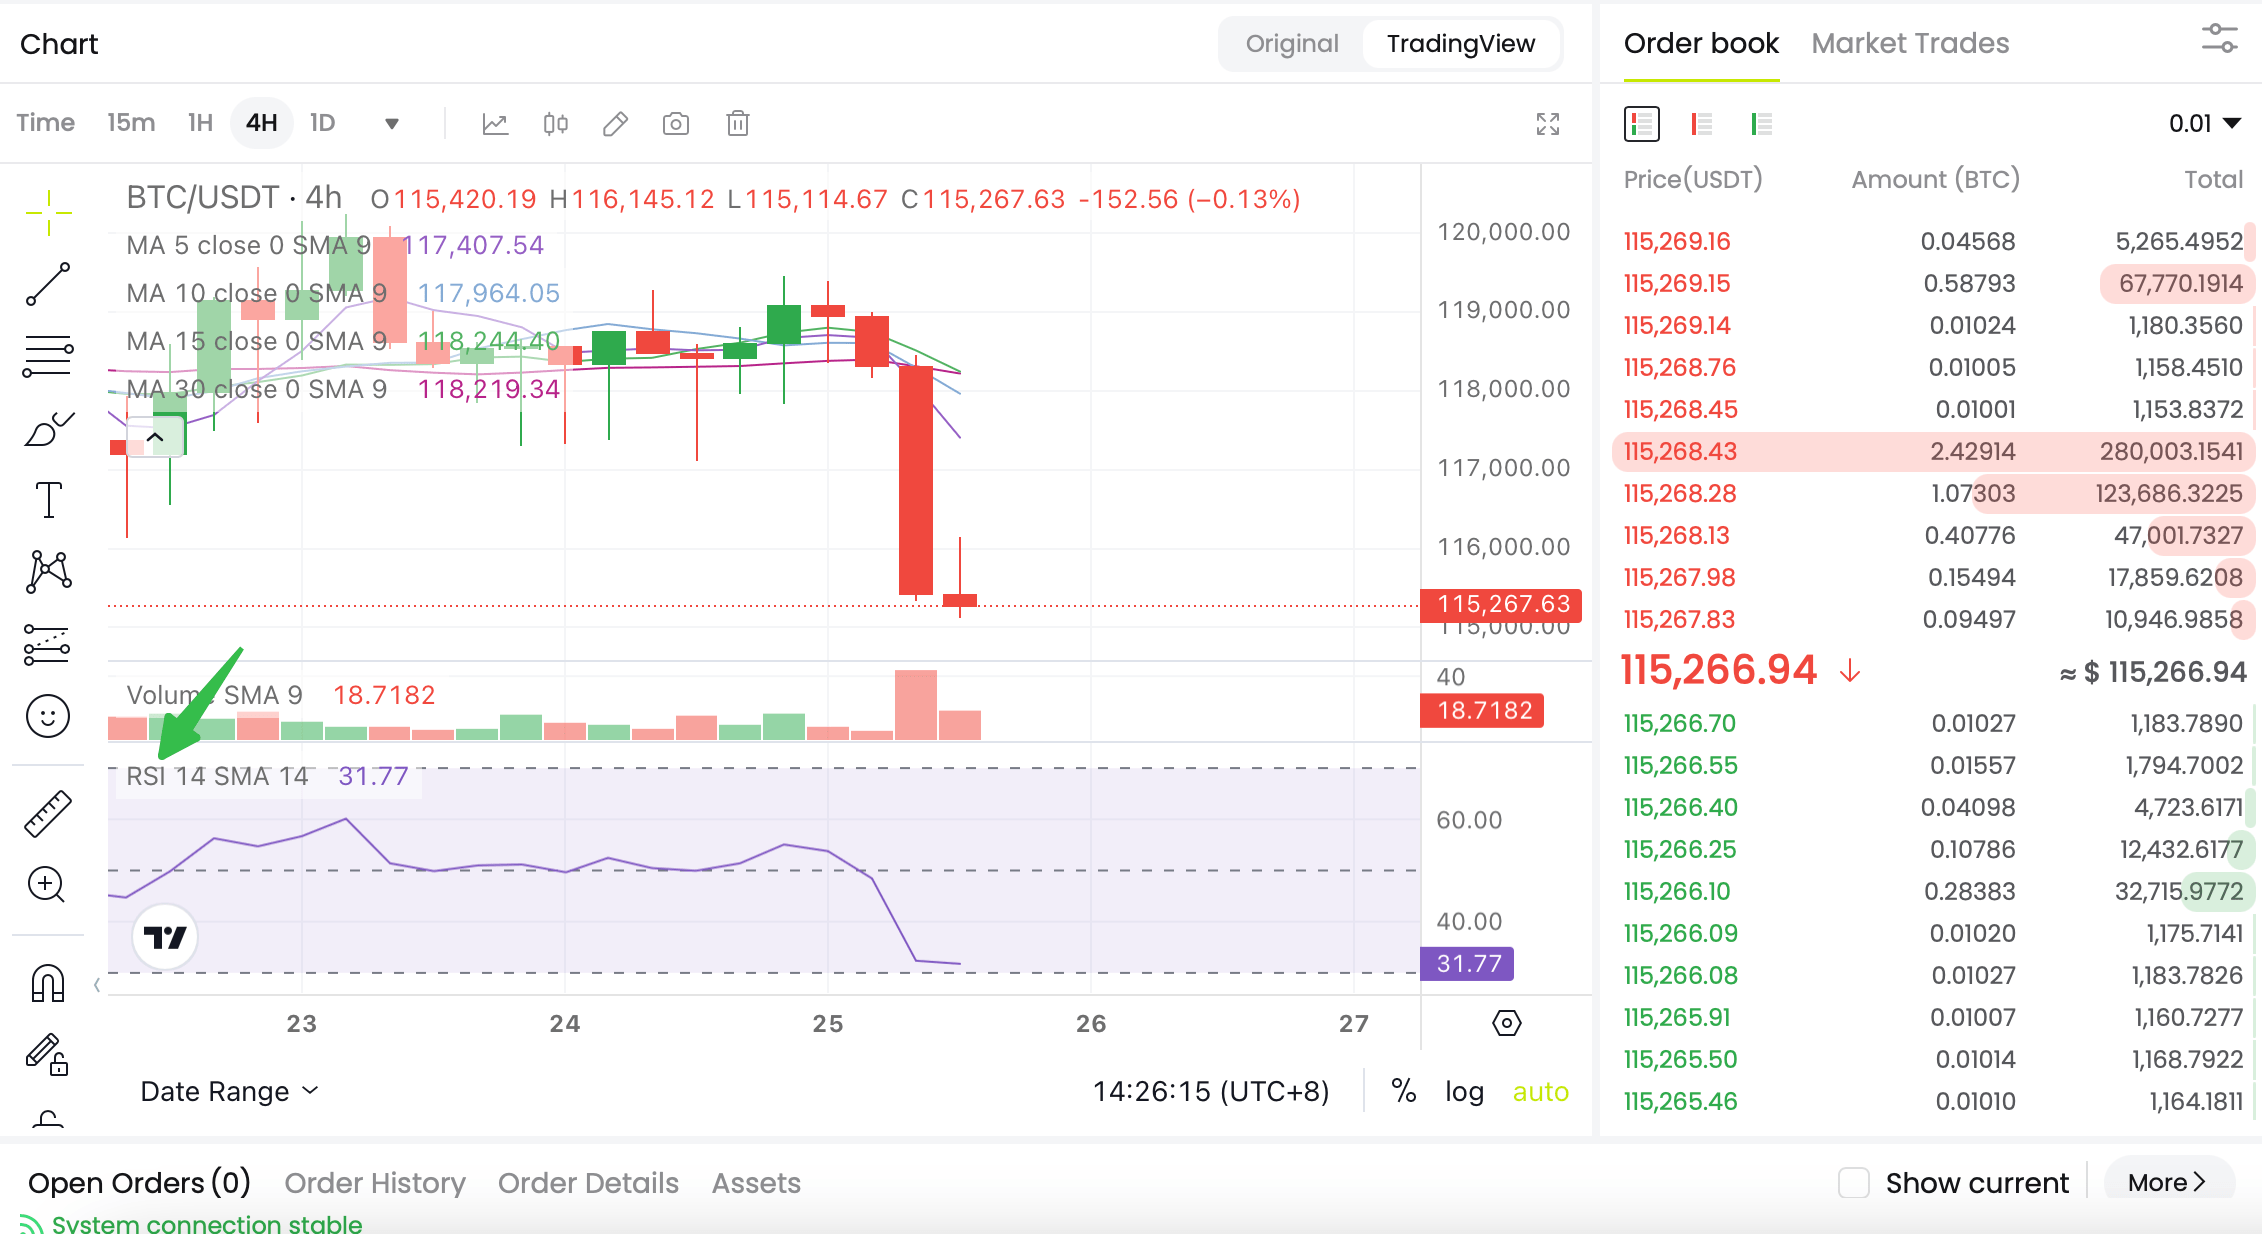
Step 3: Select RSI From Momentum Indicators
Choose the Relative Strength Index from the list of momentum indicators, and it will be automatically applied to your chart.
How to Calculate RSI
The formula for measuring Relative Strength Index (RSI) is very simple.
RSI = 100 – [100/ (1 + RS)]
Where:
-
RS = Average Gain / Average Loss
-
Average Gain = sum of gain per period/time frame
-
Average Loss = sum of loss per period/time frame
The Relative Strength (RS) is the average of upward and downward price changes over a given time period. The RSI's result/value falls between 0 and 100, indicating that the indicator is an oscillator.
The RSI timeframe on available platforms is set to 14 by default. It means that applying RSI indicators to a daily chart will consider the data from the previous 14 days; when you apply it to a weekly chart, it will consider the data from the previous 14 weeks.
On the other hand, custom settings allow you to change the value based on your needs and strategy.
How to Read RSI
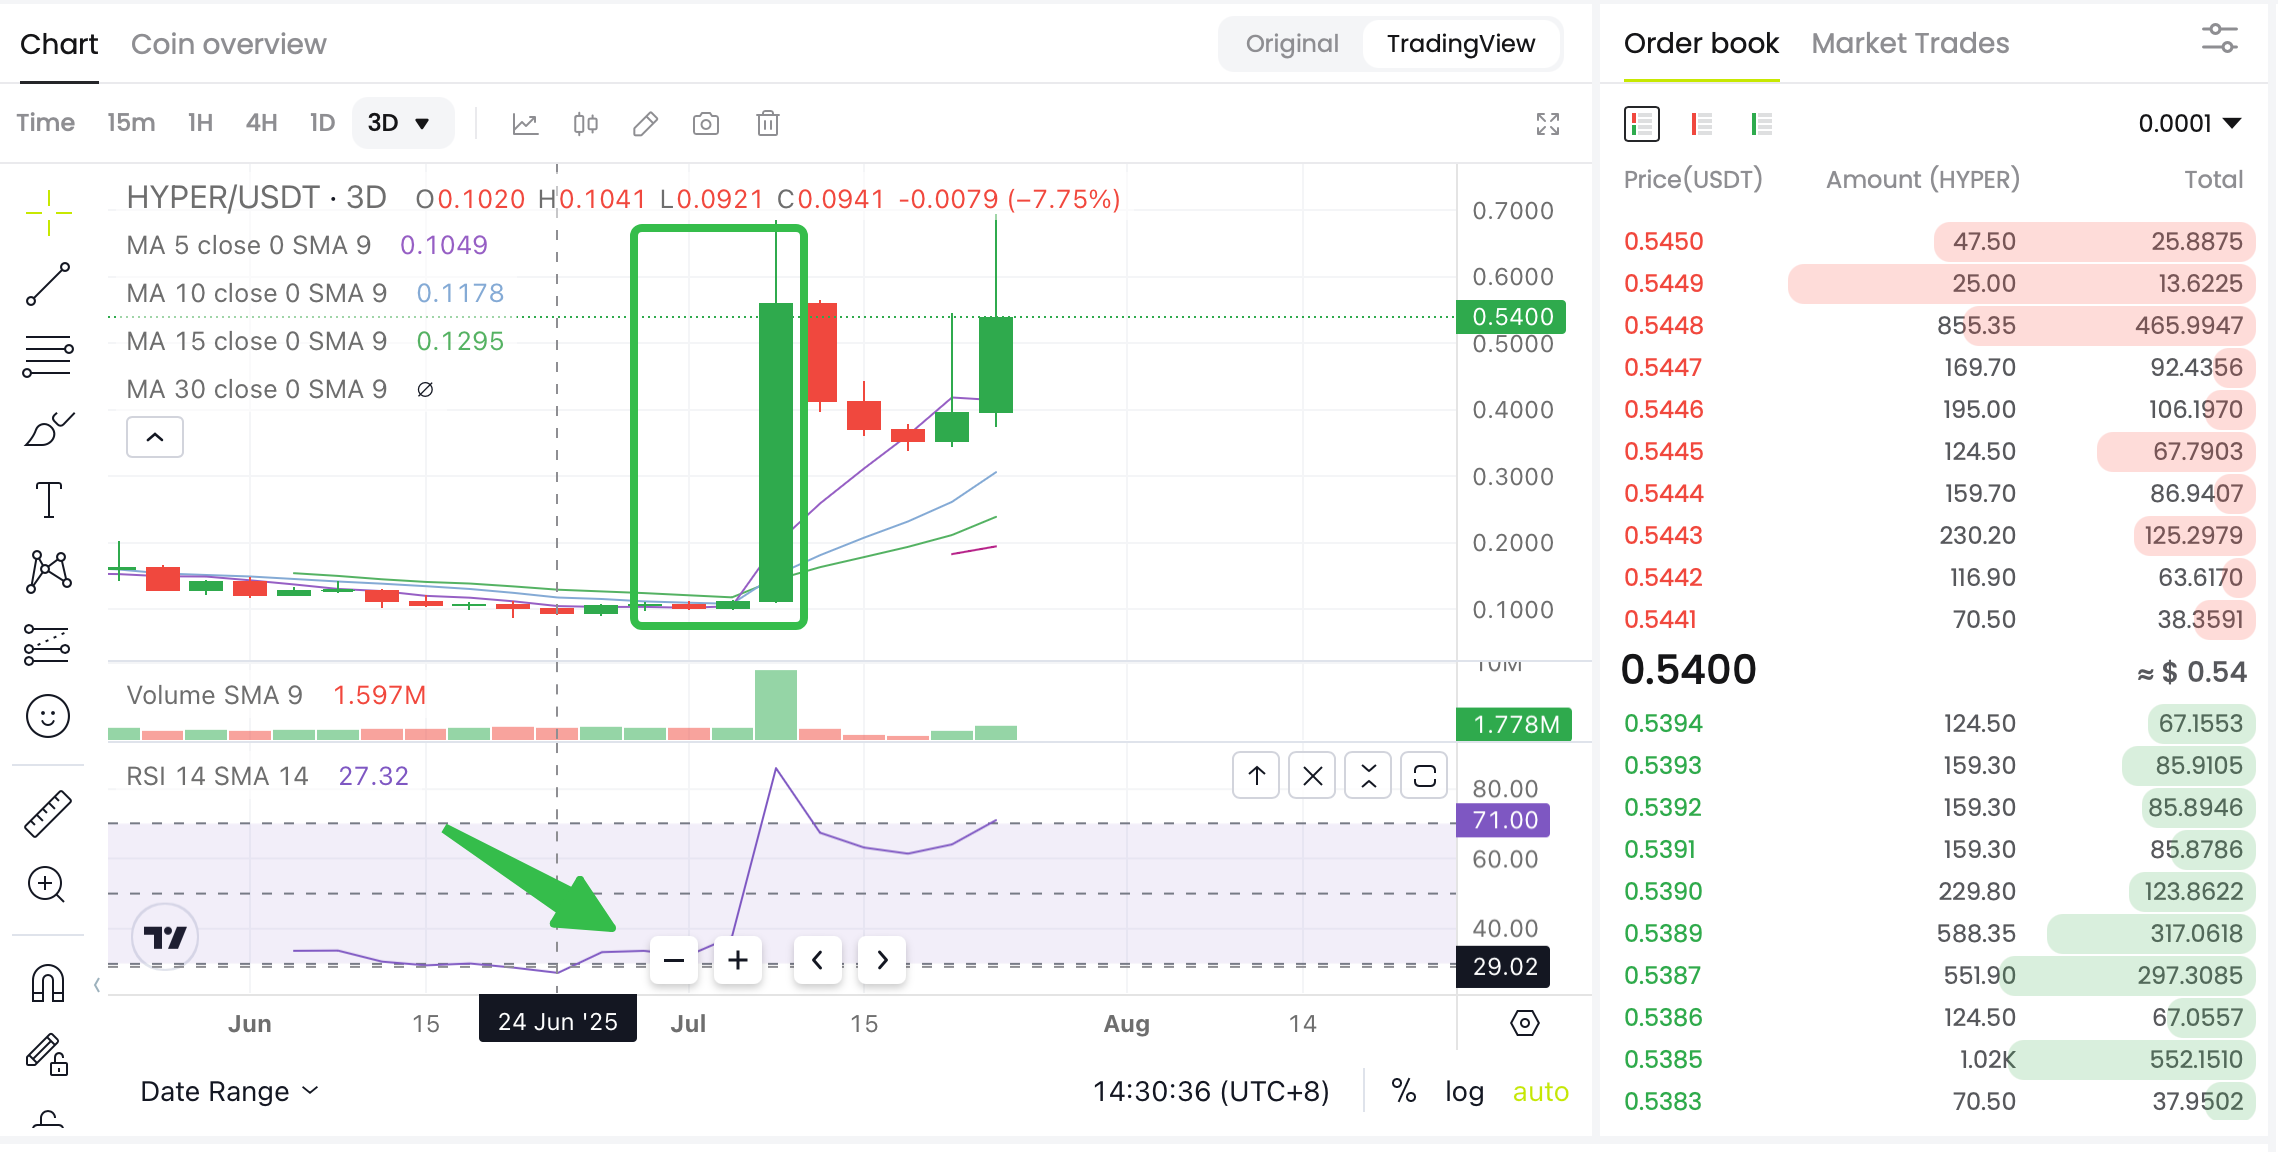
The Relative Strength Index (RSI) provides insight into the situation of an asset, whether and how much it is oversold and overbought. For instance, if the value of the RSI falls below 30, the asset is flashing an oversold signal. Similarly, if the RSI exceeds 70, the asset is in overbought territory.
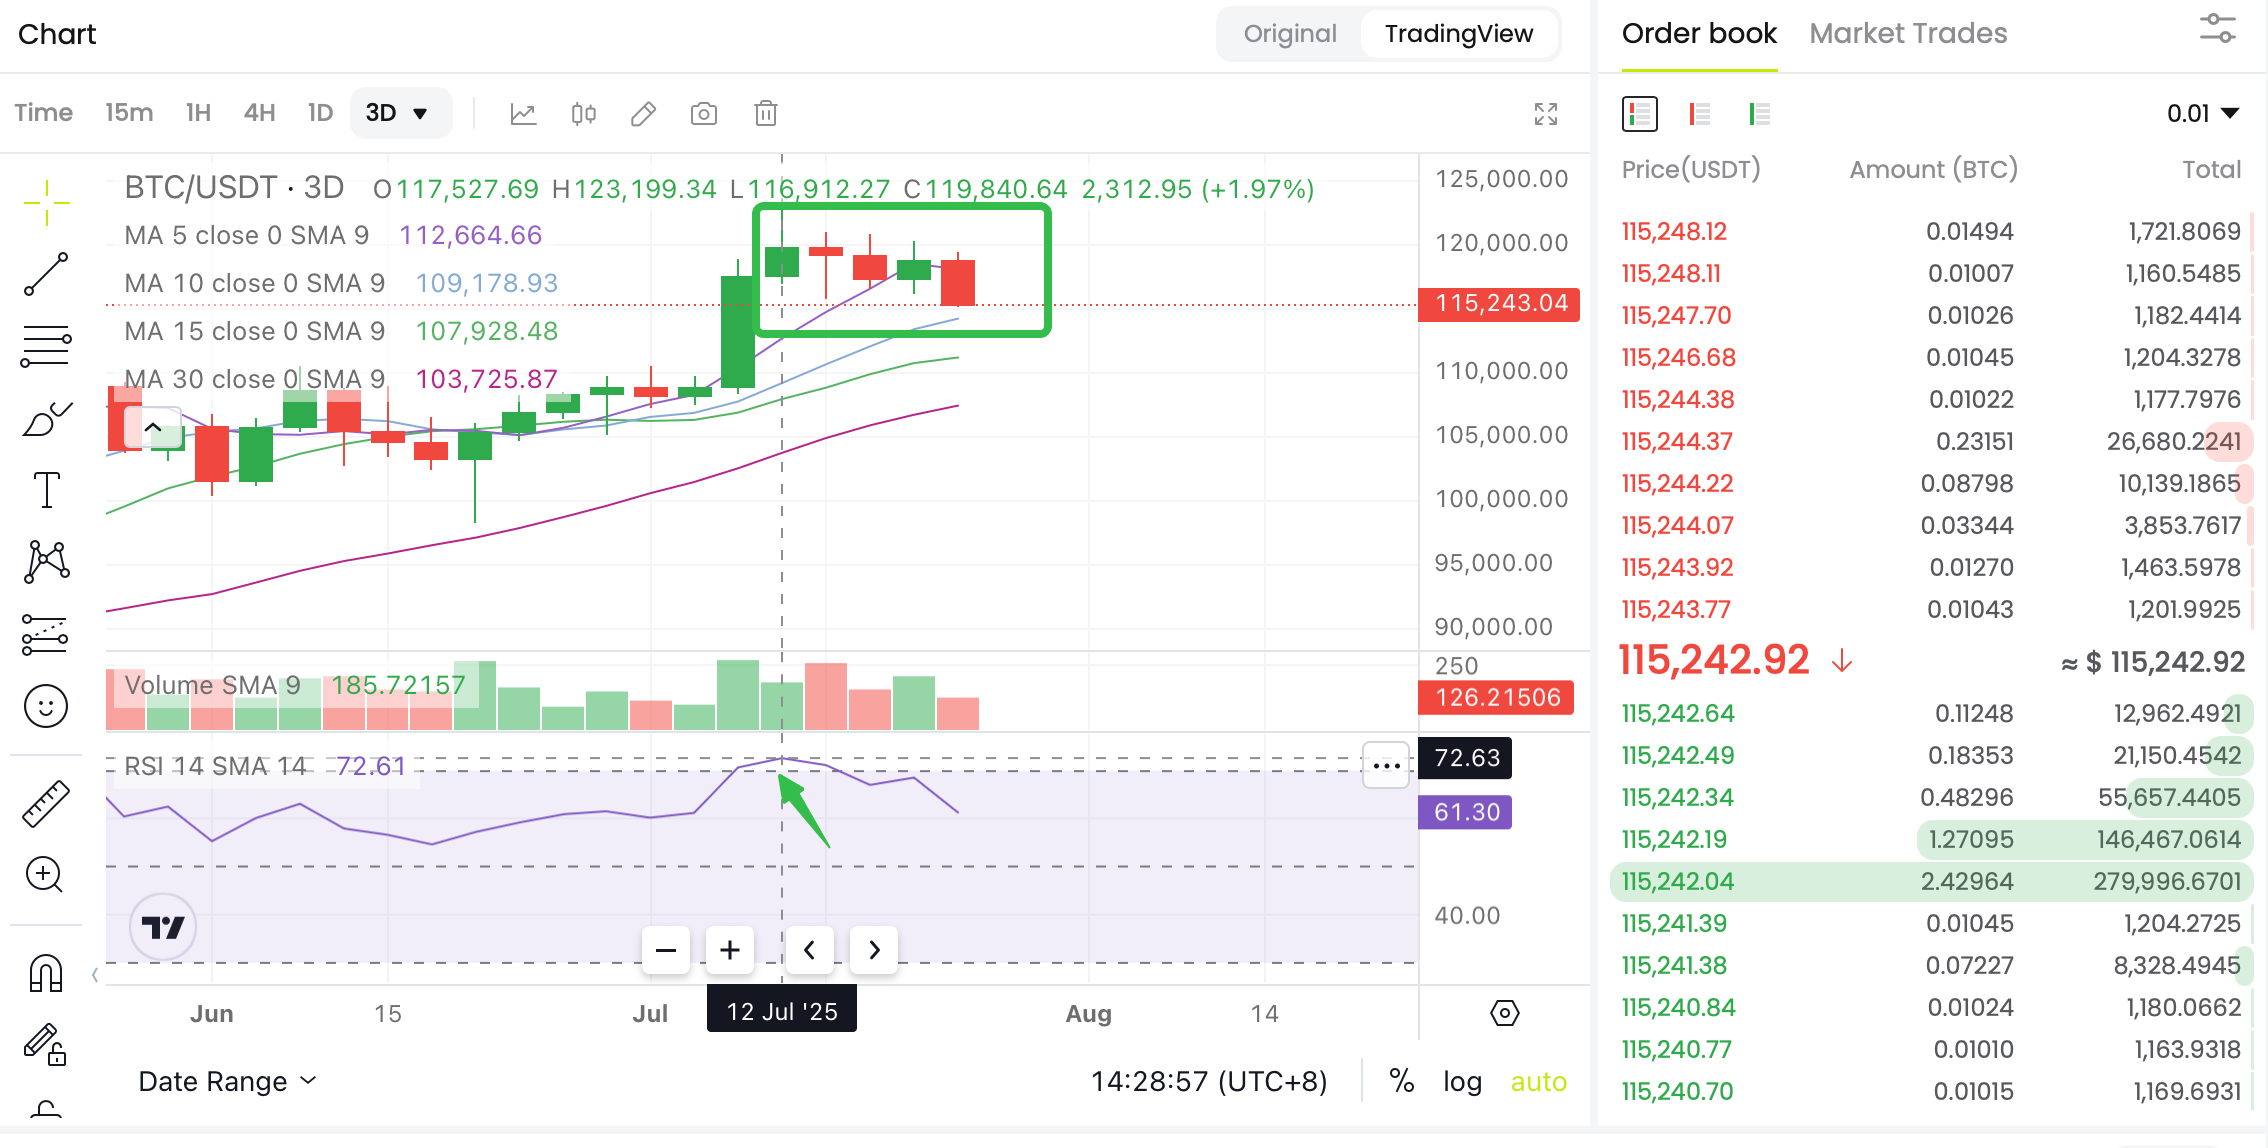
Sell Signal: Overbought RSI Indicator
When the Relative Strength Index rises above 70, the underlying asset's value rises but could reverse or fall at any time. Take a look at the Bitcoin chart shown below. The RSI value rose above 70, prompting investors to enter the market and initiate a bearish trend.
Buy Signal: Oversold RSI Indicator
On the flip side, if the RSI falls below 30, the asset decreases in value and could reverse or move on the upside.
Reading the RSI is not that difficult. That is why people first choose this indicator when learning technical analysis. However, you must remember that, like many other indicators, the RSI can also provide false alarms. Therefore, you must learn to recognize when the indicator is giving a good signal and providing a bad call.
A good trader doesn't just use one indicator to predict how the price will move in the future. Instead, he or she looks at many different indicators to make a good prediction.
Another exciting thing about RSI is that you can get an idea about the rate of speed of an asset’s price movement, but you can also look for solid signals like convergence and divergence.
Finding Moving Average Convergence and Divergence Through the RSI
First, we need to learn about these terms to understand them better. Convergence and divergence are popular terms in technical analysis. They can help you discover the market's possible future direction.
Convergence
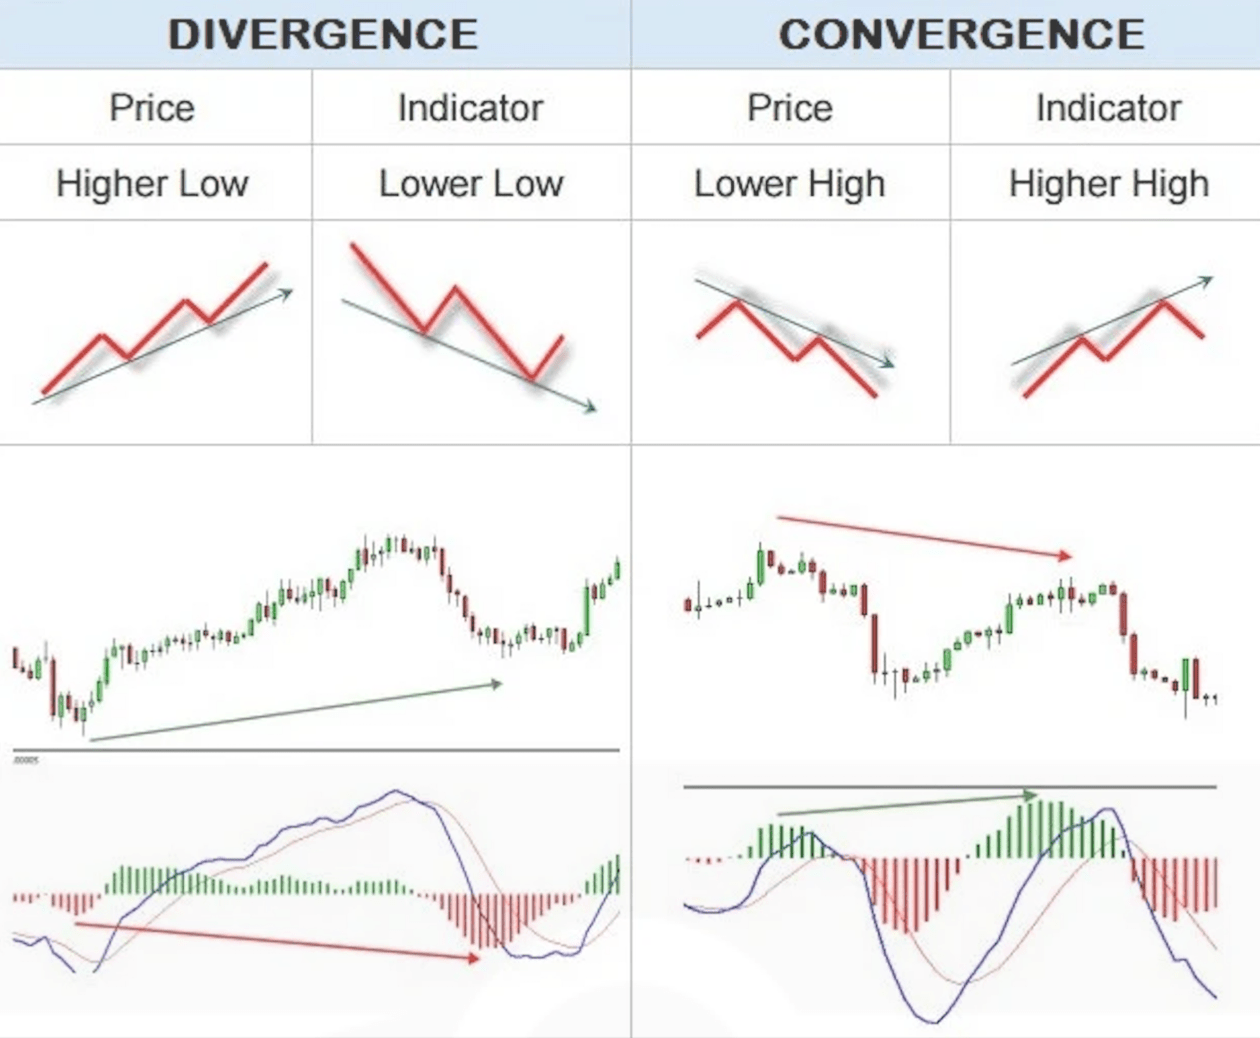
Convergence happens when the price of an asset and an indicator, such as RSI or MACD, move in the same direction. This alignment confirms that the current trend is strong and likely to continue.
Unlike divergence, where the price and indicator disagree, convergence shows agreement between them.
For example:
-
In an uptrend, both the price and the RSI are making
higher highs. This suggests that the buying momentum is strong and the trend will likely continue.
-
In a downtrend, if both the price and MACD are making
lower lows, it indicates that selling pressure is strong and the trend is still intact.
Divergence
Divergence happens when the price of an asset moves in one direction, but RSI, moves in the opposite direction.
This difference between price and indicator can signal that the current trend might change soon. Traders use
divergence patterns to spot potential reversals or continuations in the market.
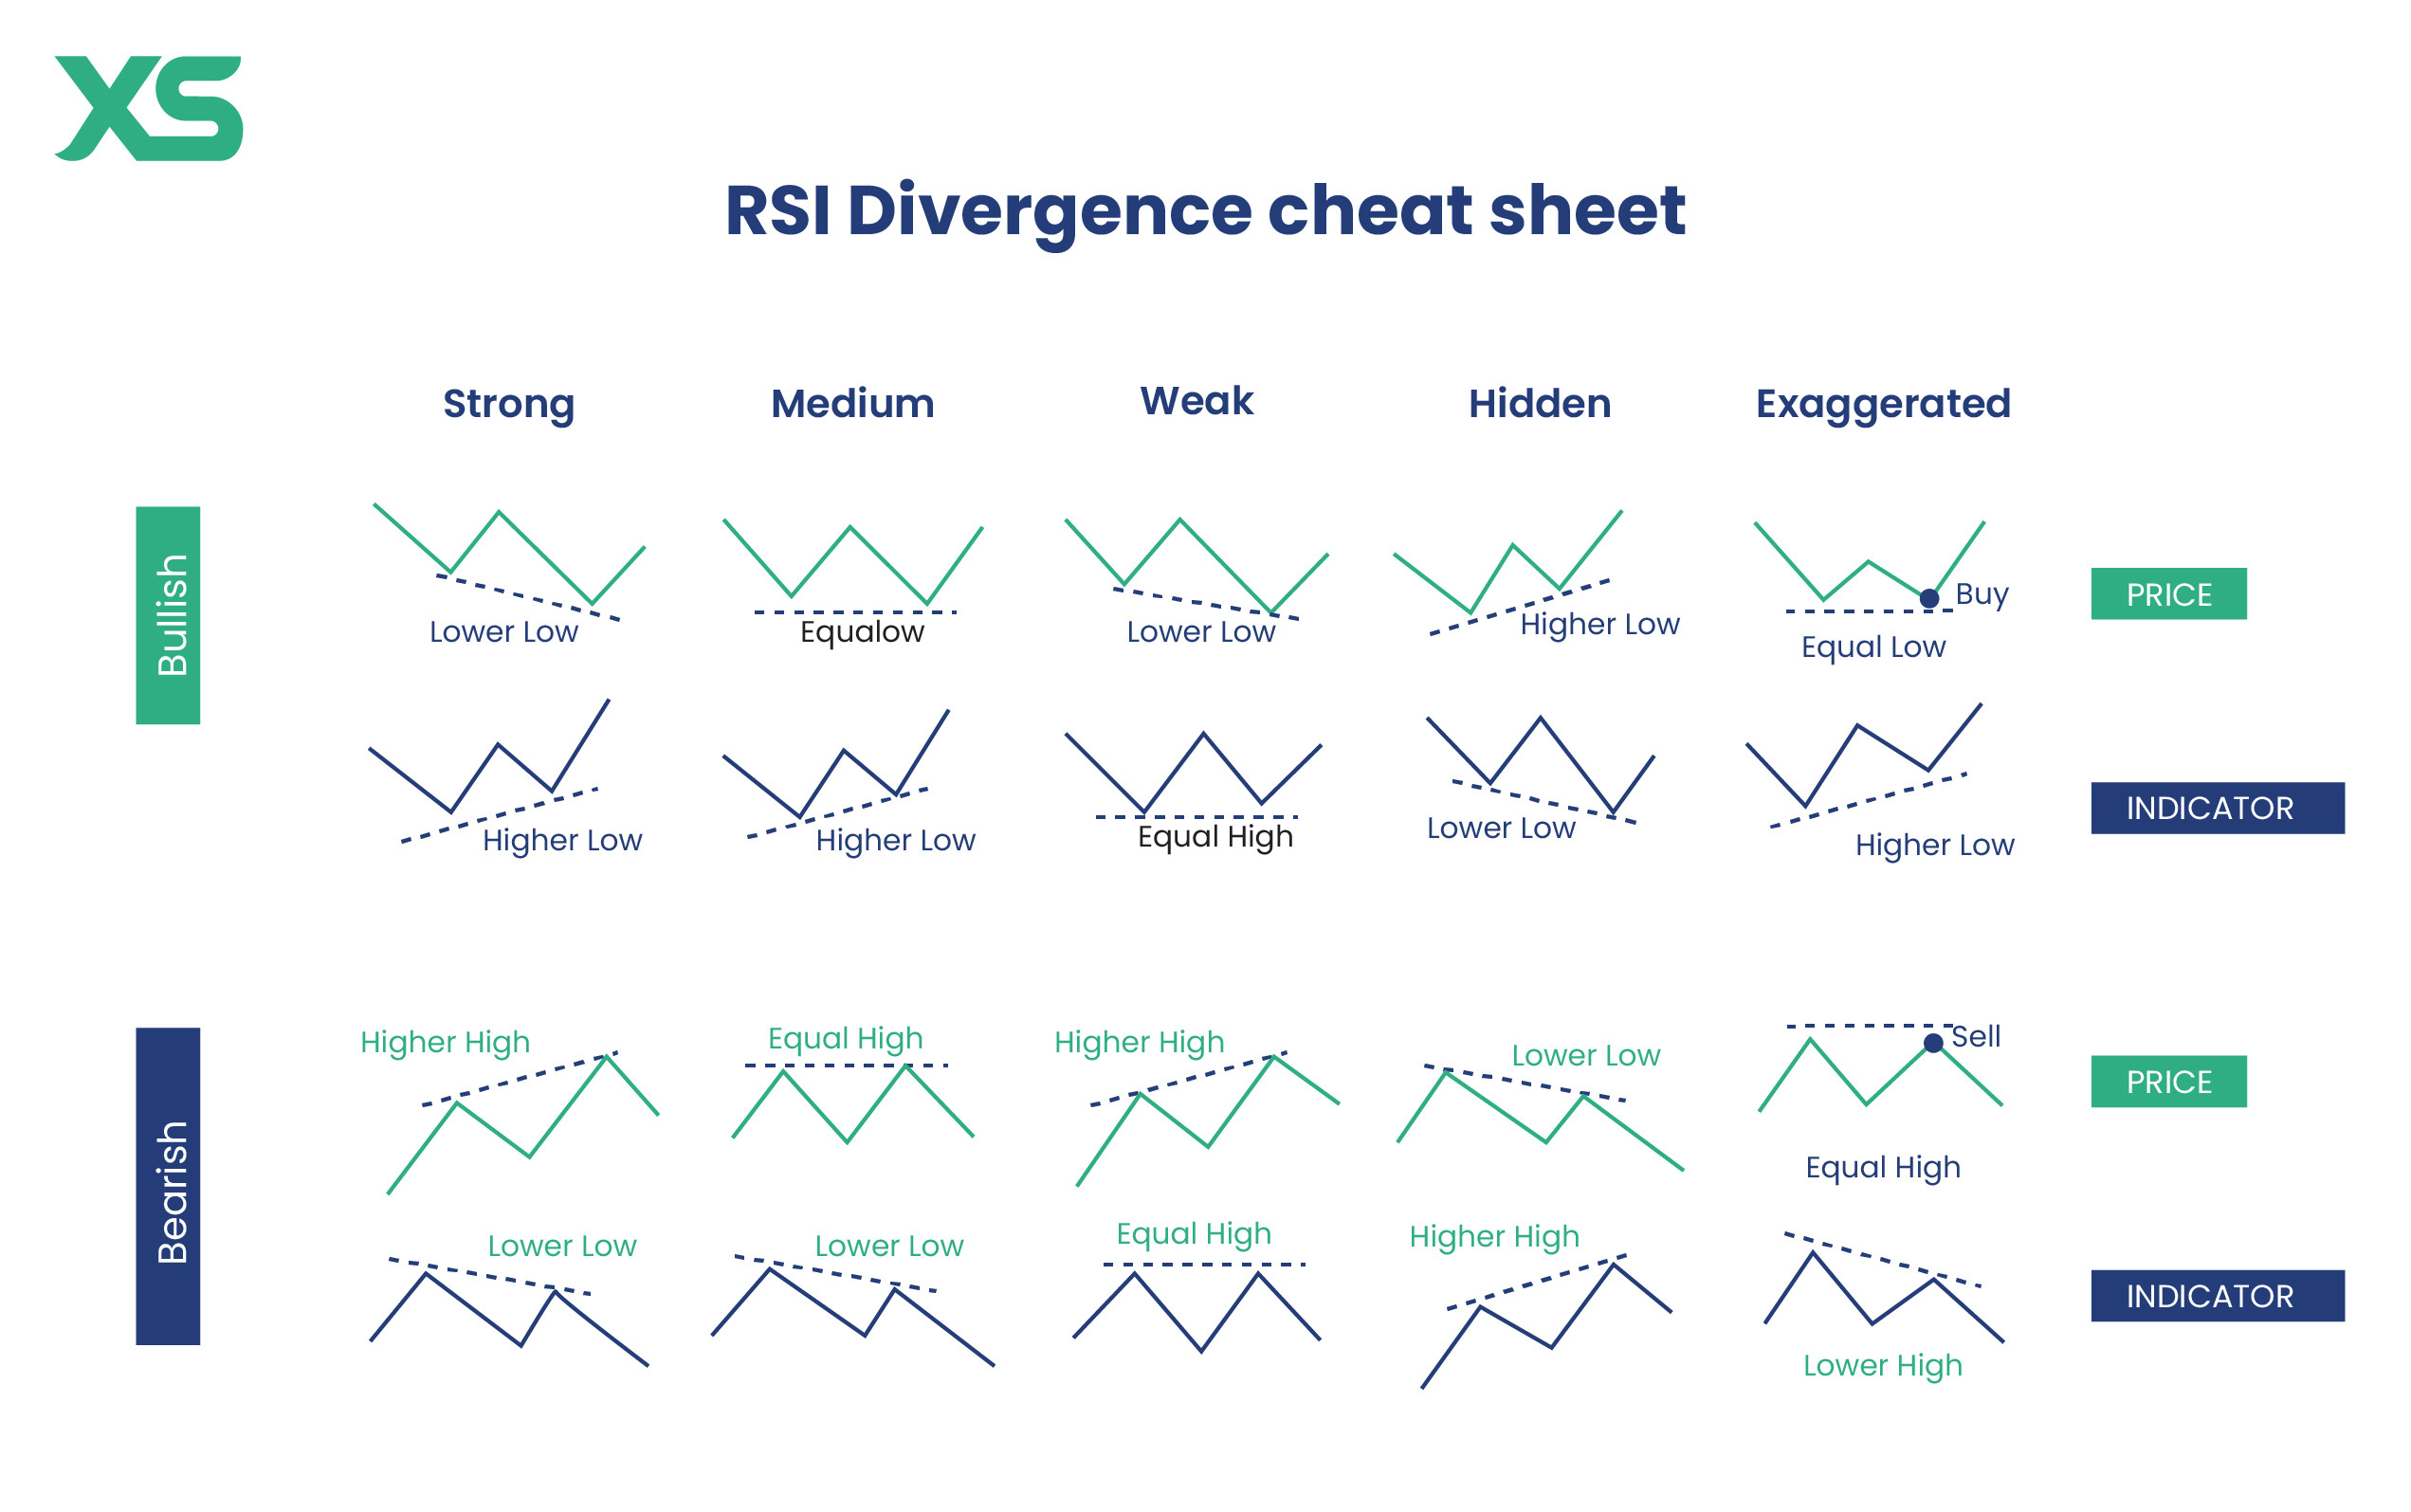
For example:
-
In a
bullish divergence, the price makes
lower lows, but the indicator makes
higher lows. This means that even though the price is dropping, the selling pressure is getting weaker, and an upward move might be coming.
-
In a bearish divergence, the price makes
higher highs, but the indicator makes
lower highs. This suggests that the buying strength is decreasing, and the price might drop soon.
Convergence and Divergence: Explained
| Feature |
Divergence |
Convergence |
| Meaning |
Price and indicator move in opposite directions. |
Price and indicator move in the same direction. |
| Implication |
Signals a possible trend reversal. |
Confirms the current trend continuation. |
| Trader’s Action |
Look for potential entry/exit points. |
Stay with the current trend. |
| Example |
Price makes higher highs, indicator makes lower highs (bearish divergence). |
Price and RSI both make higher highs in an uptrend. |
To understand and analyze these concepts, imagine a market moving at its peak. The price of an asset retraces slightly but reaches a new high. However, the technical indicator RSI is indicating less strength in the meantime.
It's the same as in the real world; when the price of something rises, the number of people buying it decreases. As a result, the salesman is forced to lower the price to attract new buyers. Similarly, the low strength of the RSI in a technical analysis indicates fewer buyers in the market while the price of an asset is moving higher. Therefore, you can predict that the bullish trend in the market will reverse or that the price could go down.
The same rule applies to the opposite movement of the price when prices are moving downwards, whereas the RSI shows strength, which means the price is likely to move higher. While determining the convergence and divergence points, you must look for signs that the price will change and then bet on the expected change.
How to Apply RSI in Crypto Trading
Before utilizing the Relative Strength Index in cryptocurrency trading, it is essential to recognize that robust signals are produced on higher timeframes. This indicates that when the RSI indicator is utilized on a 4-hour chart, the signal generated is more potent than that produced on a 15-minute chart. In other terms, while employing the RSI indicator, one might observe a bullish divergence on a 15-minute chart, which may not be present on a 1-hour chart. Additionally, it is crucial to maintain the RSI settings at 14, as this is the standard configuration. Many trading strategies for digital assets leverage the RSI to create trade signals. Now, let us examine how RSI calculations can be applied to predict future trading outcomes.
Finding Overbought & Oversold Signals
Using a single indicator to generate a trading signal can be risky and not advised. You must use a mixture of technical indicators to confirm the one signal provided by a single indicator.
You can go for that trade after confirming the signal from various indicators. You can use the RSI to find the overbought and oversold levels in the market. However, it can be risky as the market can keep moving in the same direction after hitting the oversold or overbought level.
Using the RSI indicator to define these levels can give you an insight into the market situation, which can be useful for making a final decision after receiving further confirmation from different indicators.
Bullish and Bearish Divergence & Convergence
Trading cryptocurrency based on divergence and convergence can be interesting as it gives deep insight into the market and helps generate strong signals. The phenomenon where the price chart of crypto is rising and showing bullish momentum, but the RSI value is moving on the downside, is known as bearish divergence.
RSI values give us a warning that the bullish trend of crypto is going to be weak or end in the near future. You can find these divergences and start opening positions in the market accordingly.
Similarly, bullish/bearish convergence can also be found in the price chart of a cryptocurrency to make bets on the future price momentum of the crypto.
One thing to remember about divergence is that it usually occurs at the end of a trend. In this case, price lines are used in conjunction with the RSI indicator to determine whether a price chart is overbought or oversold. Typically, the price does not move in the opposite direction immediately after the signal appears on the chart, so the price lines are adjusted to avoid gaps.
Using the Relative Strength Index, you can generate fewer trade signals if he sets the overbought and oversold levels to 80 and 20 instead of 70 and 30. The price lines will lengthen, allowing for more reliable trading signals.
Conclusion
The Relative Strength Index (RSI) is commonly considered the most effective technical indicator, especially for day and swing traders. This indicator provides insights into market activity and suggests appropriate decision-making.
The RSI crypto indicator assists in assessing market conditions by signaling whether a cryptocurrency is overbought or oversold. Additionally, it can help identify market divergence and convergence, which is particularly beneficial for swing traders.
Calculating the RSI is straightforward; it is available for free on nearly all crypto trading platforms. Despite being a popular technical indicator, it is not advisable to base price predictions solely on the RSI. Nevertheless, integrating the RSI with other indicators such as Stochastics, MACD (moving average convergence divergence), and trend lines enhances overall effectiveness.
A successful trader should avoid depending on a single indicator and instead ensure that the signals produced by various indicators align in the same direction. Consequently, this approach reduces the likelihood of incurring losses and increases the potential for profits.
Reference:
CoinCatch Team
Disclaimer:
Digital asset prices carry high market risk and price volatility. You should carefully consider your investment experience, financial situation, investment objectives, and risk tolerance. CoinCatch is not responsible for any losses that may occur. This article should not be considered financial advice.