Ethereum (ETH), the second-largest cryptocurrency by market capitalization, recently experienced a sharp decline, breaking below the critical $4,000 support level and triggering a market-wide liquidation of over $1 billion. This downturn, led by ETH, has left investors questioning whether the asset has reached its bottom or if further losses are imminent. This article examines Ethereum’s recent price performance, the factors behind its decline, the influence of whale activity, the role of institutional treasuries, and key technical indicators to assess its potential trajectory.
Recent ETH Price Performance
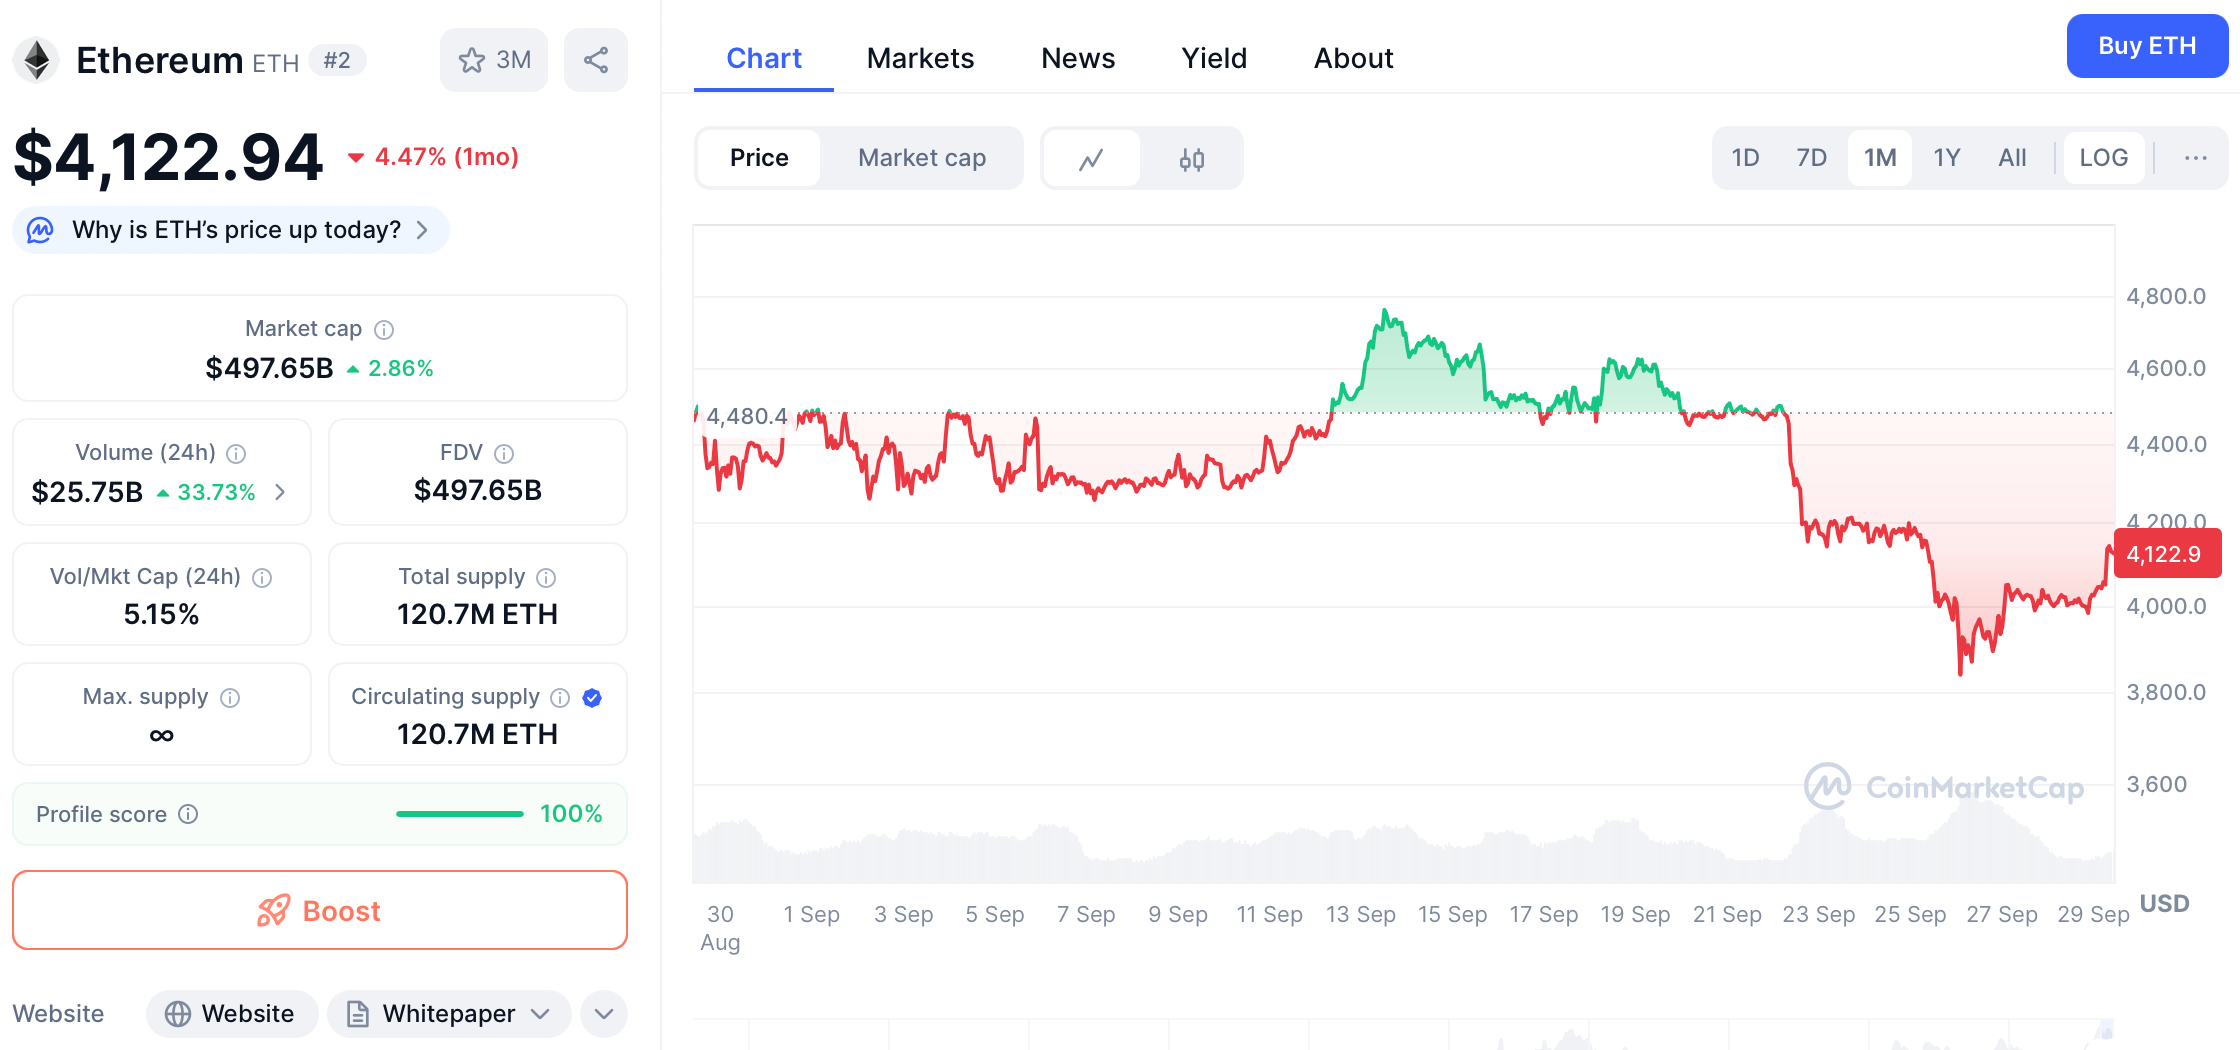
In late September 2025, ETH’s price dropped below $4,000 for the first time since August, hitting a low of $3,822 before a slight rebound. This represented a
12% weekly decline, making it one of the worst-performing weeks since June. The sell-off intensified as ETH broke below a symmetrical triangle pattern, a technical formation that previously provided support. Analysts identified $3,560 as the next critical support level, with a potential drop to $3,300 if this level fails.
The downturn was part of a broader market correction that wiped nearly $300 billion from crypto market capitalization. Bitcoin (BTC) also fell by 5%, but ETH’s losses were more pronounced due to its higher sensitivity to leverage and derivatives trading.
Why Did ETH Price Fall?
ETH price in September. Source: CoinMarketCap
The sell-off was driven by a combination of macroeconomic, technical, and market specific factors:
Leveraged Liquidations: Over $500 million in ETH long positions were liquidated in 24 hours, forcing large-scale sell-offs. This created a cascade effect, as leveraged traders faced margin calls and amplified downward pressure.
Macroeconomic Pressures: A strong U.S. dollar, rising bond yields, and uncertainty around Federal Reserve policies reduced risk appetite . Additionally, geopolitical tensions and potential U.S. government shutdown fears contributed to bearish sentiment.
Technical Breakdown: ETH failed to break above the $4,500–$4,600 resistance zone, followed by a breakdown below the $4,200 support level. This turned market momentum bearish and triggered algorithmic selling.
Regulatory Uncertainty: Delays in crypto legislation (e.g., MiCA in the EU) and ETF outflows ($76 million in a single day) dampened institutional confidence.
Reduced Staking Demand: A surge in validator exit queues and declining staking inflows weakened buy-side support.
Whale Influence: Accumulation Amid Panic
Despite the downturn, on-chain data reveals significant accumulation by large holders (whales). For example:
-
An
OTC whale purchased 60,333 ETH ($238.7 million) at an average price of $4,230, despite facing $16 million in unrealized losses.
-
Lookonchain reported that whale addresses added 400,000 ETH to accumulation wallets on September 24.
This "smart money" activity suggests confidence in ETH’s long-term value. Historically, whale accumulation during downturns has preceded bullish reversals, as it reduces sell-side pressure and sets a floor for prices.
ETH Treasury Influence: Institutional Demand and Exchange Supply
Institutional treasuries have played a pivotal role in shaping ETH’s supply dynamics. Notably:
Exchange reserves plummeted to 16.3 million ETH, the lowest level since 2016. This indicates a shift toward long-term holding or DeFi participation, reducing immediate selling pressure.
BitMine alone holds 2.4 million ETH (over 2% of supply), while 68 entities acquired 5.26 million ETH since April 2025.
However, ETF flows have been mixed. BlackRock’s ETHA saw $26.47 million in outflows, while Fidelity’s FETH recorded $33.26 million in withdrawals. This short-term institutional caution contrasts with the long-term trend of treasury accumulation.
Technical and On-Chain Signals
Oversold Conditions: ETH’s Relative Strength Index (RSI) on daily charts hit 14.5, its lowest since June 2025 . Similar RSI levels in the past preceded rallies of up to 134% within two months.
Key Levels:
-
Support: $3,820–$3,900 (defended during the sell-off) and $3,560 (critical level for bulls).
-
Resistance: $3,960–$4,000 (near-term) and $4,400 (50-day moving average).
Analysts like Ted Pillows and Michael van de Poppe argue ETH is "entering a buy zone," with the potential to reach $6,800 by late 2025 if momentum reverses.
Conclusion: Bottom Formation or Further Downsides?
ETH’s price action reflects a battle between short-term panic and long-term conviction. While leverage unwinding and macro headwinds could push prices toward $3,300, whale accumulation, declining exchange reserves, and oversold signals suggest a bottom is near. For investors, holding above $3,800 is critical for bullish invalidation. A break below $3,560 may delay recovery, but the structural trend—driven by institutional demand—remains intact.
References:
CoinCatch Team
Disclaimer:
Digital asset prices carry high market risk and price volatility. You should carefully consider your investment experience, financial situation, investment objectives, and risk tolerance. CoinCatch is not responsible for any losses that may occur. This article should not be considered financial advice.