The cryptocurrency market is experiencing a significant downturn, with Bitcoin failing to hold the critical $100,000 support level and sinking to half-year lows in early November 2025. This decline has triggered massive liquidations exceeding $2 billion across the market, particularly affecting long positions. The current bearish sentiment stems from a complex interplay of factors, including Wall Street sell-offs, Federal Reserve policy concerns, ETF outflows, and troubling internal developments within the crypto ecosystem. This analysis examines the key drivers behind Bitcoin's recent price movement and explores potential scenarios for its future trajectory, drawing on technical indicators, macroeconomic developments, and on-chain data to provide a comprehensive market perspective.
BTC Price Has Fallen Lower Levels
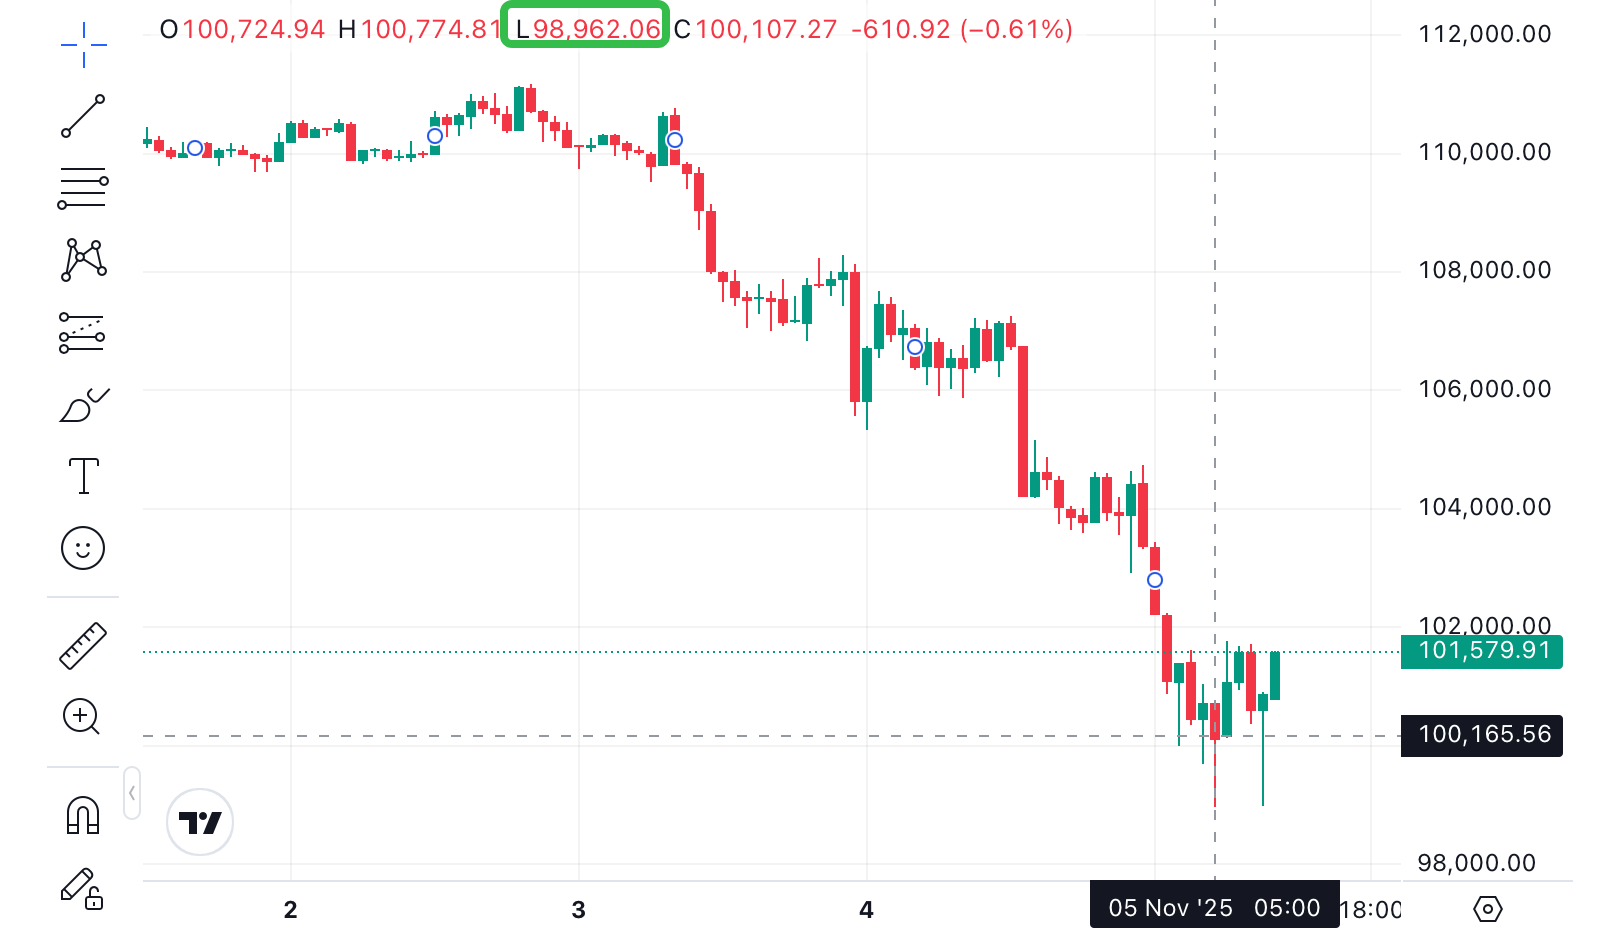
Bitcoin has fallen to even lower levels than during the "10.11" crash, failing to hold the $100,000 mark and even dropping below $99,000, a new low in the past six months. Ethereum touched a low of $3,000.
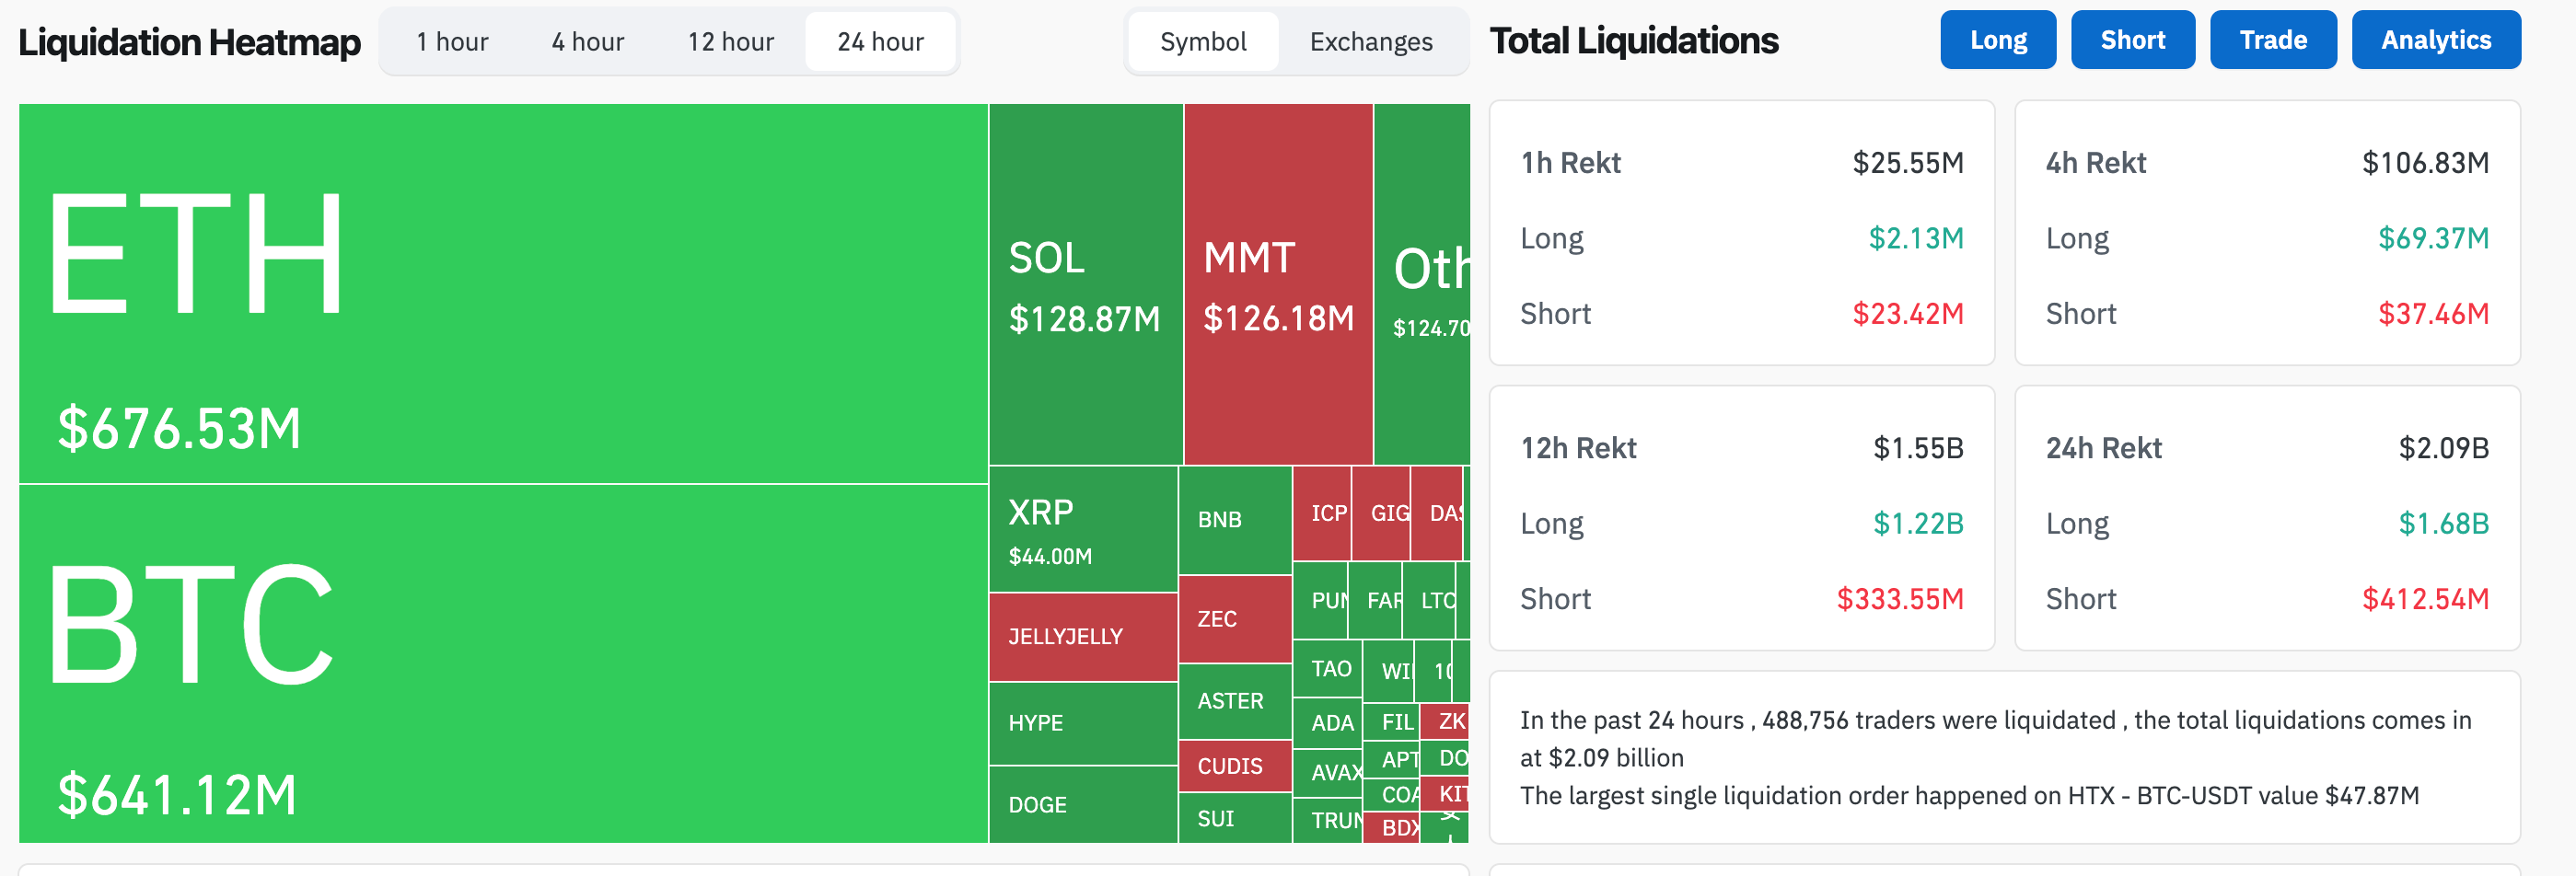
The total amount of liquidation across the network in 24 hours exceeded $2 billion, with long positions losing $1.68 billion and short positions losing $400 million.
Liquidation map. Source: Coinglass
The Macroeconomic Backdrop
Bitcoin's performance has become increasingly correlated with broader macroeconomic forces, particularly central bank policies and global liquidity conditions. The U.S. Federal Reserve's signals about ending Quantitative Tightening (QT) while maintaining higher interest rates have created a complex environment for risk assets.
According to analyst Cristian Chifoi, Bitcoin appears to be following the 2022 playbook, but in reverse. In 2022, the Fed's aggressive rate hikes triggered a 63% crash in Bitcoin's price. Now, with the Fed preparing to end QT by December 2025, similar macro forces could potentially push prices in the opposite direction over time. Chifoi suggests that the next three-month window could trigger a powerful bullish surge that might drive Bitcoin to cycle tops rather than bottoms, with late December through January 2026 being a key period to watch.
However, not all analysts share this optimism. Data highlighted by analyst Brett shows that after the Fed ended QT in 2019 and began rate cuts, Bitcoin fell 35% despite growth in U.S. stock markets. The cryptocurrency market didn't recover until the Fed launched full-scale quantitative easing in early 2020 amid COVID-19 concerns.
The Fed's decision to end QT and begin reinvesting maturing debt into short-term Treasury bills effectively creates new money, even if the agency avoids calling it QE. Economist Lyn Alden notes that when the Fed injects cash into the financial system by buying T-bills, it grants more cash reserves to sellers of those Treasuries, potentially increasing market liquidity.
Meanwhile, analyst André Dragosch challenges conventional wisdom by arguing that Bitcoin has not shown a stable correlation with Fed net liquidity. Instead, he emphasizes global money supply as the most relevant driver for BTC performance. This perspective suggests traders should focus on broader global monetary trends rather than U.S.-centric liquidity measures.
Technical Analysis
From a technical perspective, Bitcoin's failure to maintain support above $100,000 has triggered significant bearish momentum. The cryptocurrency now faces critical tests at several important technical levels.
Currently, Bitcoin is trading above its 50-week simple moving average of $102,934 and 200-week moving average of $54,756, which some analysts view as a potentially constructive setup. However, the absence of a bullish crossover between the 20- and 50-period Exponential Moving Averages warrants caution among traders.
Analyst Jesse Olson has pointed to a "pending bearish MACD crossover" on Bitcoin's three-week chart, a technical signal that preceded a 69% market correction in 2021-2022. If history repeats, Bitcoin faces downside risks before any new liquidity-driven rally emerges.
Key support levels to monitor include $106,623, $103,423, and the critical $101,833 level that marked October's lows . A breach below these levels could open the path toward $88,000, which glassnode identifies as the "active investor realized price" .
On the resistance side, Bitcoin would need to reclaim $114,000 to signal potential recovery momentum, with more significant hurdles at $118,000-$125,000. The $107,000 level represents an important near-term threshold; according to Markus Thielen of 10x Research, a break below this support could trigger a move toward $100,000.
ETF Outflows and Institutional Sentiment
The spot Bitcoin ETF market, which previously drove significant institutional inflows, has recently become a source of selling pressure. Data reveals substantial outflows from major Bitcoin ETFs, contributing to the current downturn.
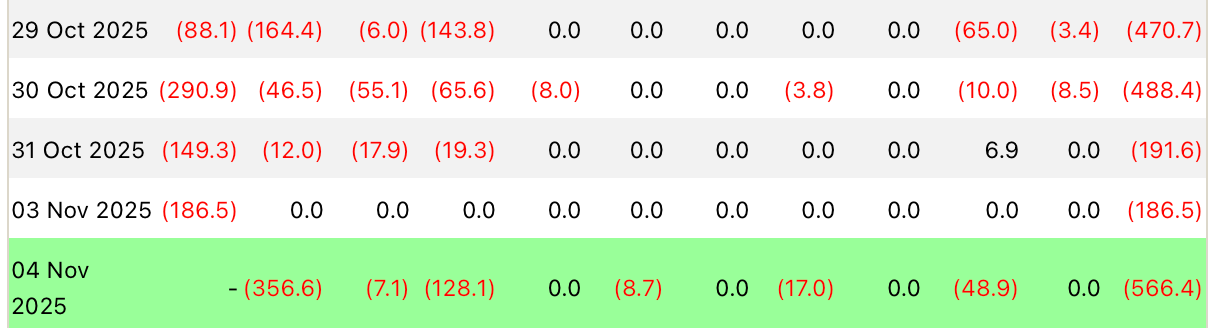
From October 28 to November 3, Bitcoin ETFs experienced total outflows of nearly $8 billion, with BlackRock's IBIT alone accounting for over 50% of these outflows at $4.03 billion. On October 31, IBIT recorded a single-day outflow of $149 million, the highest in the industry's history.
The BTC ETFs keep outflows. Source: Farside
Other major ETFs, including Fidelity's FBTC, Grayscale's GBTC, Bitwise's BITB, and ARK 21Shares' ARKB, have also seen significant redemptions. This trend suggests a notable shift in institutional sentiment, as these products had previously attracted substantial institutional capital following their approval.
The ETF outflows coincide with reported selling from long-term Bitcoin holders. Over the past 30 days, addresses holding Bitcoin for more than 155 days have sold approximately 405,000 BTC, representing about 2% of the circulating supply and worth roughly $42 billion at period-average prices.
Interestingly, while mid-sized holders (10-1,000 BTC) have been distributing coins, wallets holding over 1,000 BTC have actually been modest accumulators, suggesting that larger players maintain longer-term confidence despite the correction.
Potential Scenarios
Analysts remain divided on Bitcoin's near-to-medium-term trajectory, with predictions ranging from significant further declines to substantial rallies by year-end.
The bearish case suggests potential downside toward $70,000-88,000. Glassnode has identified the active investor realized price around $88,000 as a potential support zone if Bitcoin cannot reclaim the short-term holder cost basis ofapproximately $113,000. Similarly, economist Timothy Peterson has warned that if the Federal Reserve implements no rate cuts in 2025, it could trigger a broader market decline that pulls Bitcoin back toward $70,000.
The more extreme bearish scenario comes from Chinese crypto influencer Bannu Xia, who suggests that Bitcoin could decline to $84,000 before entering a prolonged consolidation period.
Conversely, several analysts maintain bullish outlooks for late 2025 and early 2026. Michael Saylor of MicroStrategy continues to predict Bitcoin reaching $150,000 by end-2025, citing ongoing institutional adoption. Other analysts, including Bedouin, point to growing liquidity potentially pushing Bitcoin toward the $130,000-180,000 range by 2026 .
Historical patterns also offer some optimism. Over the past 15 years, the fourth quarter has typically been bullish for Bitcoin, with an average gain of 51.04%. If this pattern holds, the current consolidation could represent an accumulation zone before a year-end rally.
Critical Factors to Monitor
Several key developments will likely determine Bitcoin's direction in the coming weeks:
Federal Reserve Policy: The Fed's planned end to Quantitative Tightening in December, along with any signals about future rate changes, will be crucial for market liquidity conditions.
ETF Flow Reversal: A return to positive inflows for Bitcoin ETFs would signal restored institutional confidence and potentially catalyze a price recovery.
Technical Level Holds: Bitcoin's ability to maintain support above $100,000-101,000 will be technically significant for preventing another leg down.
Global Liquidity Measures: As André Dragosch notes, global money supply metrics may be more relevant than Fed-specific liquidity for Bitcoin's performance, making these broader indicators important to watch.
On-chain Metrics: Changes in exchange reserves, holder behavior patterns, and miner selling pressure will provide early signals of market structure shifts.
Conclusion
Bitcoin is navigating a perfect storm of negative catalysts, including Wall Street risk aversion, Federal Reserve policy uncertainty, institutional ETF outflows, and internal ecosystem challenges. The breach of key psychological and technical support at $100,000 has undoubtedly damaged near-term sentiment.
However, historical patterns and several analyst projections suggest the potential for a significant recovery into year-end and early 2026, particularly if macroeconomic conditions become more favorable. The Fed's planned end to Quantitative Tightening in December could mark an important inflection point for market liquidity.
Traders and investors should monitor the key factors outlined above, particularly ETF flow data and critical technical levels, for signs of either continued deterioration or stabilization. While the path forward appears volatile, Bitcoin's fundamental thesis remains intact, with the current correction potentially creating attractive entry points for those with longer-term horizons and appropriate risk tolerance.
References:
CoinCatch Team
Disclaimer:
Digital asset prices carry high market risk and price volatility. You should carefully consider your investment experience, financial situation, investment objectives, and risk tolerance. CoinCatch is not responsible for any losses that may occur. This article should not be considered financial advice.