The KDJ is a momentum-based indicator used in technical analysis to assess market trends and potential turning points. It’s a close cousin of the stochastic indicator, which compares a security’s closing price to its price range over a set period. What sets the KDJ apart is its inclusion of an extra line called the J line, which enhances sensitivity to price movements. This article explores the KDJ indicator's mechanics, its practical application in cryptocurrency trading, and its role in a modern trader's toolkit.
Origin and Evolution: From Stochastics to Crypto Charts
The KDJ indicator is a refined derivative of the more widely known Stochastic Oscillator, created by George Lane in the late 1950s. Lane's original Stochastic Oscillator focused on the premise that in an upward trend, closing prices tend to cluster near the high of the period's range, and conversely, near the low in a downward trend. The indicator aimed to measure the momentum of price movements relative to a recent range.
The KDJ indicator evolved from this concept, introducing a third line (the J line) and often utilizing a different smoothing formula. While the core calculation remains deeply rooted in Lane's stochastic philosophy, the "KDJ" nomenclature and its specific three-line presentation gained particular popularity in Asian financial markets before proliferating globally with the rise of digital trading platforms. Its migration into cryptocurrency trading was a natural progression. As crypto exchanges integrated sophisticated charting packages like TradingView, the KDJ became readily available to a new generation of traders. Its responsiveness to quick price changes made it seemingly well-suited for the 24/7, fast-paced crypto markets, where traditional indicators could appear sluggish.
Components Breakdown: The K, D, and J Lines
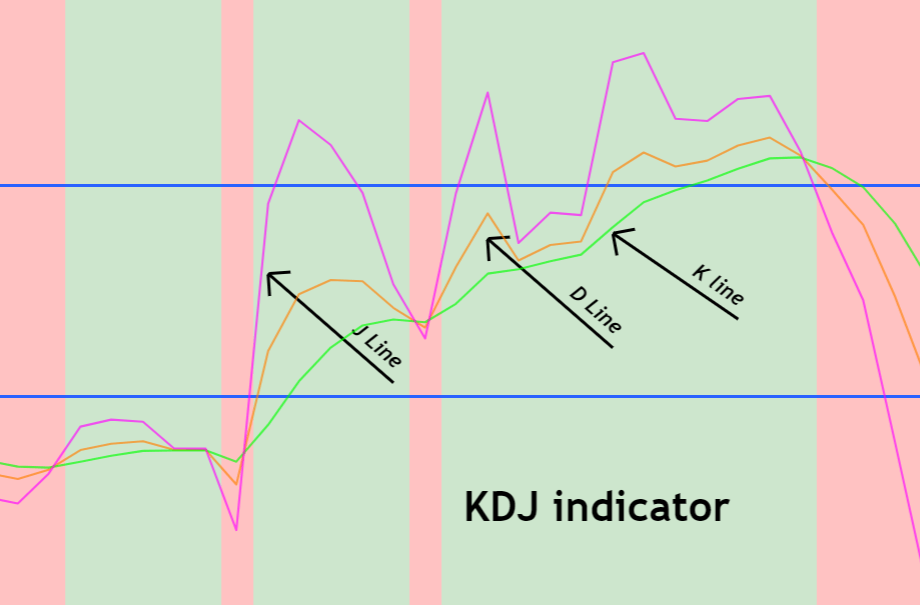
The KDJ indicator plots three distinct lines on a sub-chart, typically scaled from 0 to 100. Understanding each component is crucial to its interpretation.
The indicator consists of three key components:
-
%K (k value): Reflects the current price’s position relative to the recent high-low range. The k values are used in calculation.
-
%D (d value): A smoothed version of %K, providing a more stable signal. The d value is crucial for interpreting market trends.
-
%J (extra line called the J line): A calculated value derived from K and D, specifically: %J = 3K – 2D. It magnifies movements and helps identify extreme market conditions.
The interplay between these three lines forms the basis of all KDJ trading signals.
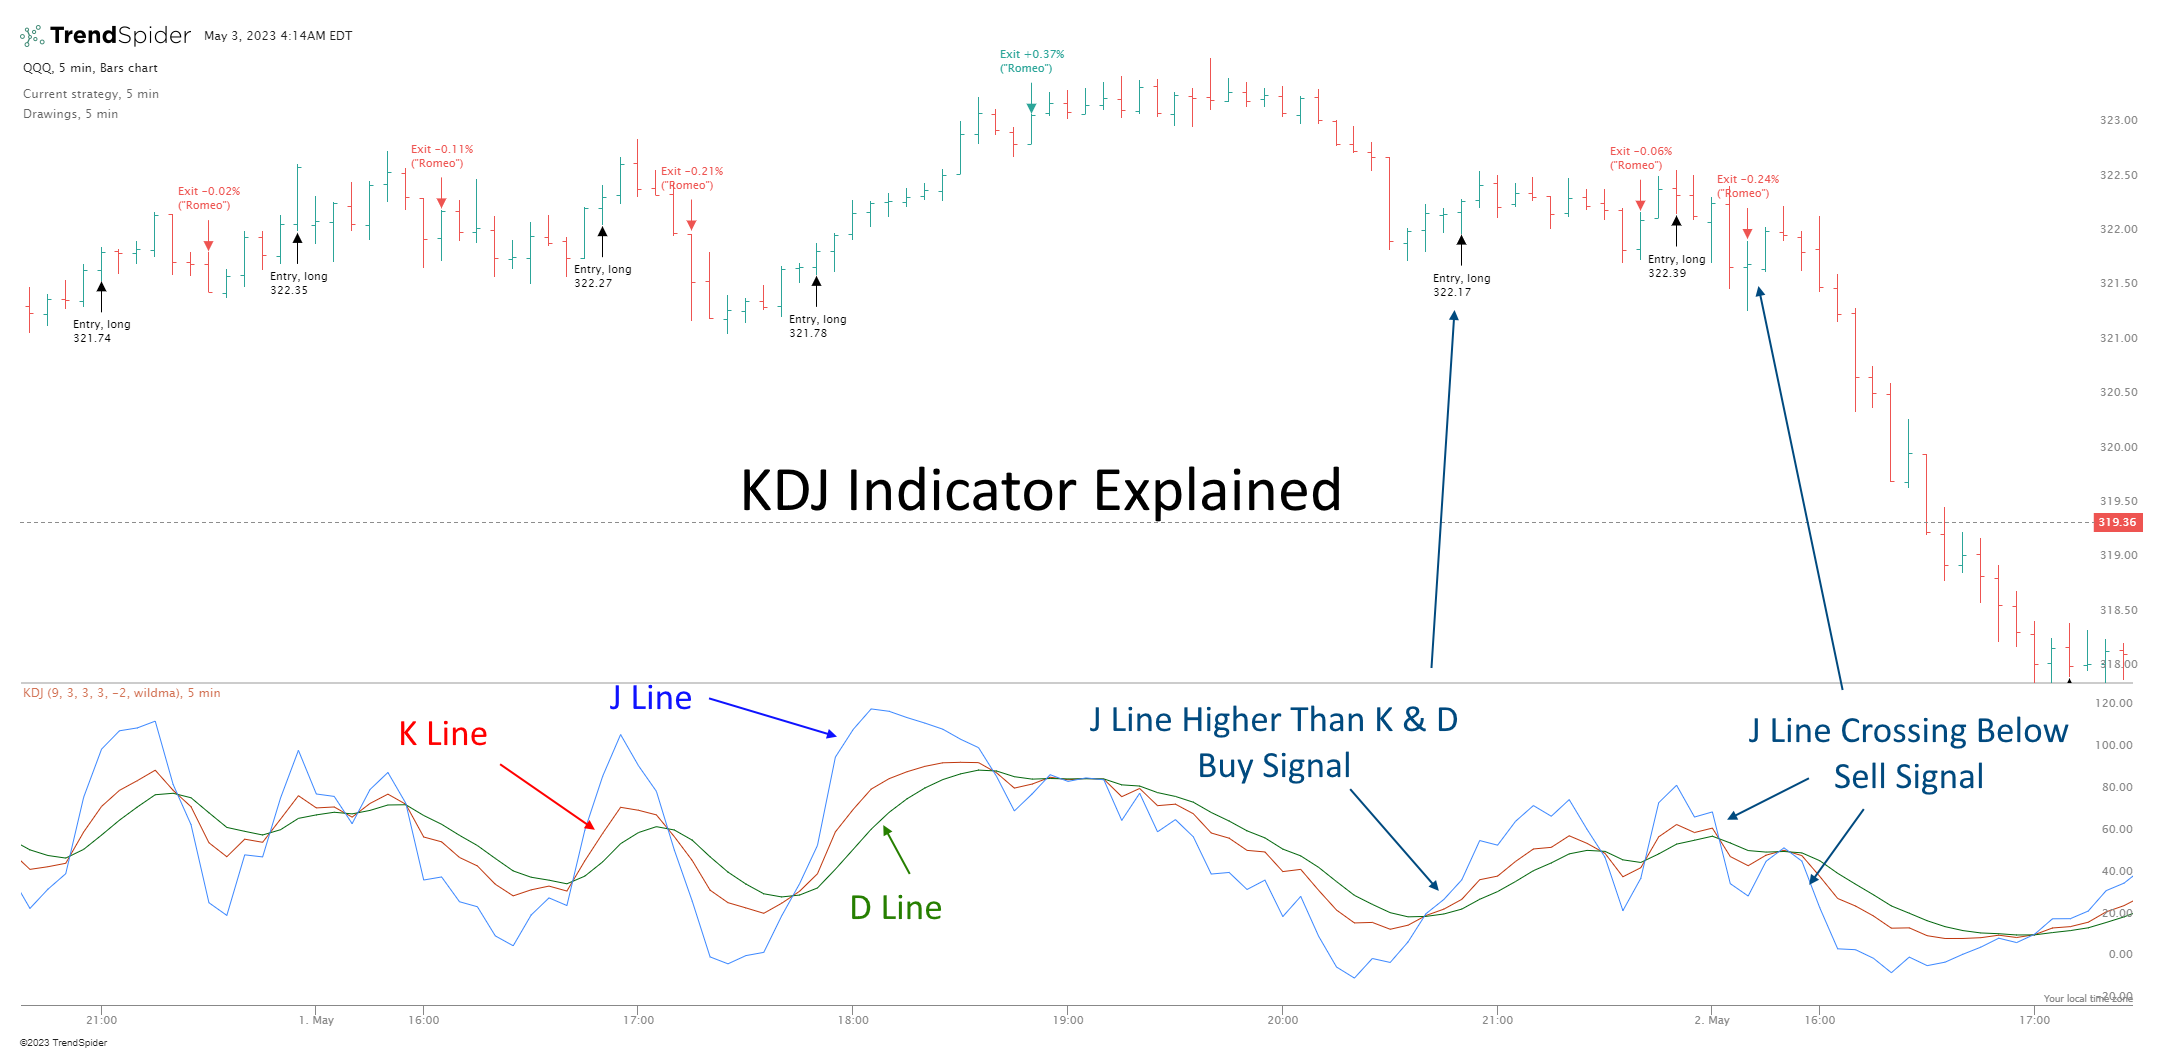
Interpretation Basics: Reading the Signals
Interpreting the KDJ indicator revolves around three primary concepts: level readings, line crossovers, and divergences.
Overbought and Oversold Levels: The most straightforward signal. The 80 and 20 levels are standard thresholds. When the K and D lines rise above 80, the asset is considered "overbought," suggesting the buying momentum may be exhausted and a pullback or reversal could be imminent. Conversely, when they fall below 20, the asset is "oversold," indicating selling pressure may be overdone and a bounce could occur. In strongly trending crypto markets, these levels can be held for extended periods, so they are best used as alerts rather than direct trade signals.
K and D Line Crossovers: These are key momentum signals. A bullish crossover occurs when the faster K line crosses
above the slower D line, particularly when both are in or near the oversold zone (<20). This suggests building upward momentum. A bearish crossover occurs when the K line crosses
below the D line, especially in or near the overbought zone (>80), indicating growing downward momentum.
Divergences: This is often considered the most powerful signal. A bullish divergence forms when the price of a cryptocurrency makes a lower low, but the KDJ indicator (particularly the K or D line) makes a higher low. This indicates that selling momentum is waning even as the price drops, foreshadowing a potential trend reversal to the upside. A bearish divergence occurs when the price makes a higher high, but the KDJ makes a lower high, signaling weakening buying momentum ahead of a potential downturn.
Applying the KDJ Indicator in Crypto Trading
The theoretical interpretation of KDJ must be rigorously adapted to the unique realities of the cryptocurrency market.
Reading Signals in a Volatile Context: Crypto assets can exhibit extreme volatility, causing the KDJ lines to whip between overbought and oversold levels rapidly during consolidation. A trader must distinguish between a genuine signal and mere market noise. A crossover or level breach is more reliable if it aligns with a key support/resistance level on the price chart or a significant increase in trading volume.
Adjusting Settings for Crypto Speed: The default settings for KDJ (often a 9-period look-back) may be too sensitive for crypto, generating excessive false signals. Many crypto traders opt for slightly longer settings, such as a 14-period KDJ, to smooth out the lines and produce higher-probability signals. The optimal setting can vary between different cryptocurrencies; a high-cap, more stable asset like Bitcoin might work with one setting, while a low-cap altcoin might require another to filter out noise.
Combining with Other Indicators: The KDJ indicator should never be used in isolation, especially in crypto. It is most effective when combined with other forms of analysis.
-
Identifying Overbought and Oversold Conditions with KDJ: One of KDJ’s most practical uses is in identifying potential reversal zones. When the J line pushes above 80—or even over 100—it may indicate an overbought market where prices could soon decline. Conversely, when it dips below 20 or drops into negative territory, the market may be oversold, setting the stage for a bounce. These zones become even more meaningful when accompanied by line crossovers. For example, if the K line crosses above the D line while both are in the oversold area, it may be a strong buy signal. Likewise, a downward crossover in overbought conditions could signal it’s time to sell.
-
Trend-Following Indicators: Using the KDJ alongside a trend indicator like the 50 or 200-period Moving Average is critical. In a strong uptrend, only bearish KDJ signals (like overbought crossovers) that align with a pullback to the moving average support should be considered for short entries or exits. Ignoring bullish signals in a strong downtrend prevents "catching a falling knife."
-
Volume and On-Chain Data: A KDJ bullish crossover accompanied by a surge in buying volume is a more convincing signal. Similarly, if on-chain data shows accumulation by large holders ("whales") while the KDJ is oversold, it strengthens the case for a reversal.
-
Market Structure: The KDJ signal must be read within the context of the market's higher-time-frame structure. A bullish divergence on the 4-hour chart is far more significant if it occurs at a major multi-month support level.
Case Analysis: Trading ETH with the KDJ Indicator
Scenario Setup: Let's analyze a hypothetical scenario with Ethereum (ETH) in early January 2024, following the post-ETF approval market volatility. ETH has rallied from $2,200 to $2,700 but is now showing signs of exhaustion.
Step-by-Step Analysis:
-
On the 4-hour chart, ETH price makes a new high at $2,720. However, the KDJ indicator shows a clear bearish divergence: the K and D lines have formed a lower high compared to their peak during the previous price high. This is our first warning sign that upward momentum is faltering.
-
Shortly after, the price begins to retrace. The K line crosses below the D line (a bearish crossover), and both lines are above 80, confirming the move from the overbought zone.
-
The price falls sharply to $2,450. The KDJ lines plunge deeply into the oversold territory, with the J line dropping well below 0, indicating a strong, perhaps overextended, sell-off.
-
At the $2,450 level—which also coincides with a previous 4-hour support zone and the 50-period moving average—the price forms a hammer candlestick pattern. Simultaneously, the K line hooks upward and crosses above the D line while both are below 20, forming a bullish crossover in the oversold region.
Outcome and Insights: A trader using this confluence of signals might have used the bearish divergence and crossover as a signal to take profits or initiate a cautious short position with a tight stop-loss above the $2,720 high. The subsequent bullish crossover at oversold levels, combined with the price action at key support, would have provided a high-confidence signal to exit the short and potentially re-enter a long position. This case highlights the importance of waiting for confirmation (the crossover) after an initial alert (the divergence) and combining the KDJ reading with key price levels.
Advantages and Limitations of the KDJ Indicator
Advantages:
-
Momentum Clarity: Excellent for identifying short-term overbought and oversold conditions, helping traders avoid buying at peaks or selling at troughs.
-
Early Reversal Signals: Divergences can provide early warnings of potential trend reversals before they are fully apparent on the price chart.
-
Visual Simplicity: The three lines and the bounded scale make it relatively easy to interpret at a glance compared to more complex multi-pane indicators.
Limitations:
-
Whipsaws in Ranging Markets: In sideways or choppy markets, which is common in crypto consolidation phases, the KDJ can produce numerous false crossover signals, leading to losses.
-
Failure in Strong Trends: The primary weakness. In a powerful, sustained bull or bear trend, the KDJ can remain in overbought or oversold territory for long periods. Relying solely on these level breaches to enter counter-trend positions is a recipe for significant losses, as seen when Bitcoin marches upward for weeks.
-
Lagging Nature: Like all oscillators derived from price, it is inherently lagging. It confirms what price has already been done rather than predicting the future with certainty.
Conclusion
The KDJ indicator is a potent tool in the cryptocurrency trader's arsenal, offering a structured methodology for assessing market momentum and potential turning points. Its strength lies in its ability to quantify the often-intuitive concept of "overbought" and "oversold" conditions and to reveal hidden momentum divergences. However, its application in the crypto sphere demands respect for the market's unique characteristics—extreme volatility, strong trends, and susceptibility to sentiment shocks. As with all technical indicators, the KDJ is not a crystal ball. Its greatest utility is realized not as a standalone system, but as a confirming component within a broader, disciplined trading strategy. This strategy must incorporate trend analysis, volume confirmation, risk management protocols, and an awareness of the broader macroeconomic and regulatory landscape influencing digital assets. Used judiciously, the KDJ can help crypto traders navigate the market's turbulence with greater confidence, turning chaotic price action into a map of potential opportunities.
References:
https://www.ultimamarkets.com/academy/master-the-kdj-indicator-a-traders-guide/
CoinCatch Team
Disclaimer:
Digital asset prices carry high market risk and price volatility. You should carefully consider your investment experience, financial situation, investment objectives, and risk tolerance. CoinCatch is not responsible for any losses that may occur. This article should not be considered financial advice.