Bitcoin has shown remarkable resilience throughout 2024 and into late 2025, climbing from post-halving lows to all-time highs above $126,000 earlier in the year. Yet the final months of 2025 have brought a sharp reality check. After a prolonged rally driven by institutional adoption, spot ETF inflows, and favorable macro shifts, the market entered a corrective phase in November. By mid-December, Bitcoin dipped below key psychological levels, testing investor conviction. On Monday, December 15, 2025, Bitcoin recorded its worst daily performance in weeks, falling as low as $85,171 amid heavy selling pressure and thinning liquidity.
Tuesday, December 17, brought a modest recovery, with Bitcoin bouncing back toward $87,500 during Asian and early European trading hours. This relief rally offered hope to bulls who viewed the dip as a healthy pullback in an ongoing bull market. However, analysts remain cautious. This review aligns with broader concerns about weakening momentum, macro headwinds, and technical breakdowns. In this analysis, we examine the recent price action, technical setup, on-chain signals, institutional flows, and competing analyst forecasts to assess whether Bitcoin can hold current levels or faces deeper correction ahead.
Current Market Snapshot on December 17, 2025
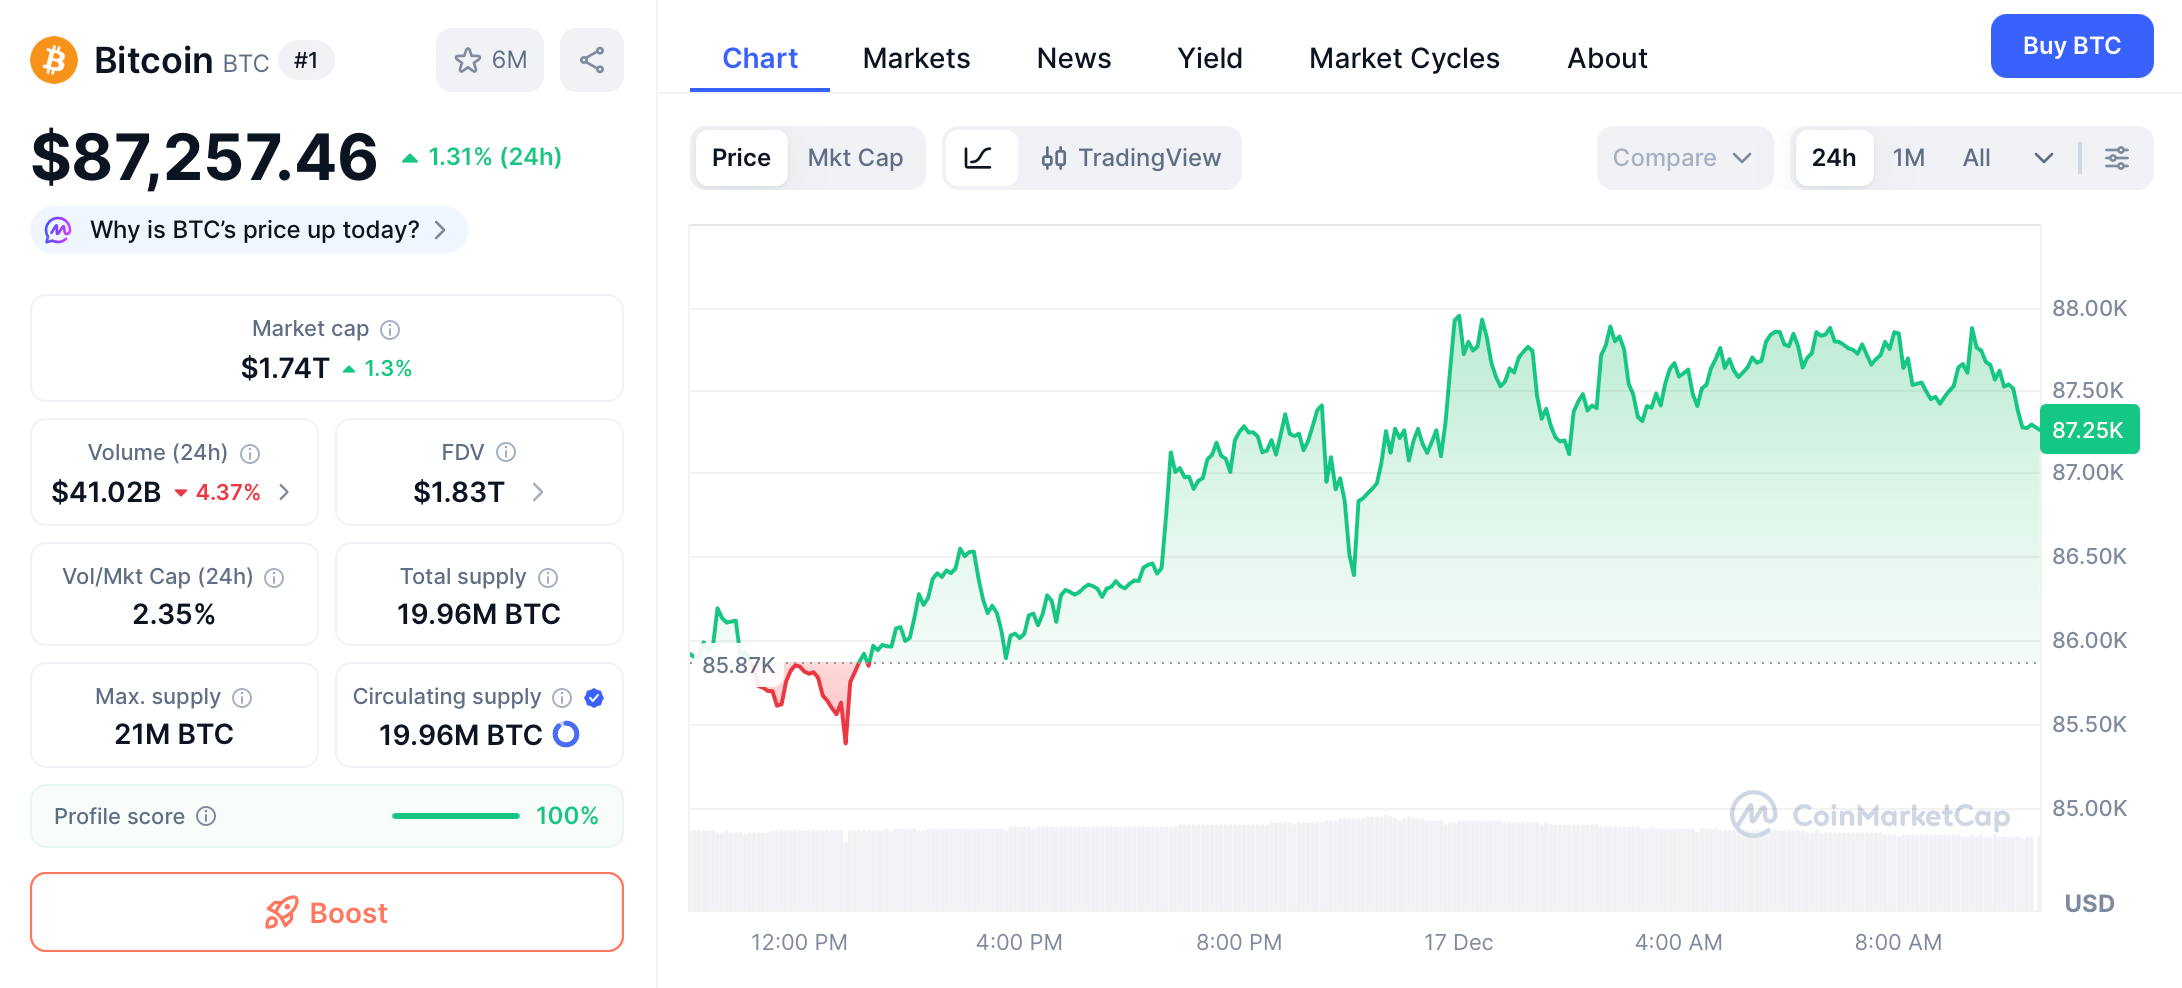
As of midday UTC on December 17, 2025, Bitcoin trades around $87,200, reflecting a roughly 2% gain from Monday's intraday lows near $85,000. The recovery has been orderly but lacks strong conviction, with 24-hour trading volume hovering around $41 billion, which is respectable but below the peaks seen during November's rally. Market capitalization stands at approximately $1.75 trillion, maintaining Bitcoin's dominance near 58-59% despite altcoin pressure.
The bounce followed a brutal weekend and Monday session where Bitcoin bled lower in thin liquidity, dropping below $86,000 for the first time in two weeks. Sentiment indicators reflect lingering fear: the Crypto Fear & Greed Index remains in "fear" territory, though it has edged up slightly from extreme lows. Derivatives markets show balanced positioning, with funding rates near neutral and open interest stable after recent deleveraging. Still, the speed of the recovery suggests dip-buying interest from both retail and institutional players, preventing a full capitulation.
Market Analysis
The Recent Dip and Monday's Lows
The sell-off that culminated on Monday did not appear out of nowhere. Bitcoin had been consolidating below $90,000 for several days after failing to reclaim $92,000 resistance earlier in the month. Weekend trading exacerbated the downside, as low liquidity amplified moves lower. By Monday, Bitcoin breached $86,000, triggering stop-losses and liquidations worth hundreds of millions. The intraday low near $85,171 marked the deepest pullback since early November, bringing Bitcoin more than 30% off its cycle high above $126,000.
Several factors converged to drive the pressure. Profit-taking after the year's massive gains played a role, as long-term holders realized gains ahead of year-end tax considerations. Additionally, broader equity markets faced turbulence, with the Nasdaq correcting amid concerns over persistent inflation and delayed rate-cut expectations. Bitcoin's correlation with risk assets remains elevated, meaning weakness in tech stocks often spills over into crypto. Finally, spot ETF outflows accelerated in early December, reversing some of the inflow momentum that had fueled the rally.
Today's Bounce: Temporary Relief or Reversal Signal?
Tuesday's price action has been more constructive. Bitcoin opened near $85,500 and climbed steadily, reclaiming $87,000 and briefly touching $88,000 before consolidating. Higher lows on the hourly chart suggest buyers are defending the $86,000 zone, a former resistance level now acting as support. Volume increased modestly on the upside, indicating genuine demand rather than a dead-cat bounce. On-chain data shows exchange inflows slowing, a sign that sellers may be exhausting themselves in the short term.
However, the recovery faces overhead supply. The $88,000-$90,000 area contains multiple moving averages and prior breakdown levels that could cap gains. Without a decisive break above $90,500, many traders view the bounce as corrective within a broader downtrend. Options markets price in elevated volatility through year-end, reflecting uncertainty about whether this relief rally can sustain momentum.
Technical Analysis: Key Levels and Indicators
From a technical perspective, Bitcoin's chart paints a cautious picture. The daily timeframe shows a series of lower highs since the November peak, forming a descending channel. Monday's dip tested the lower boundary near $85,000, where buyers stepped in aggressively. The relative strength index (RSI) on daily candles dipped into oversold territory below 30 before rebounding, a condition that has historically preceded short-term bounces.
Key support levels now cluster around $85,000-$86,000, aligning with the 50-day exponential moving average and prior range lows. A clean break below this zone would expose $80,000, a major psychological and technical floor where multiple cost-basis metrics show strong historical accumulation. Further downside could target $74,000-$75,000, matching deeper Fibonacci retracements and 2025 lows mentioned in some analyses.
On the upside, bulls need to reclaim $90,650 to shift momentum. Above that, $92,000-$93,000 represents the next significant hurdle before a potential retest of $100,000 becomes feasible. Volume profile analysis highlights thin liquidity above current prices, meaning any breakout could accelerate quickly—but the path of least resistance appears downward until proven otherwise.
Analyst Perspectives: The Case for Sub-$80,000
The bearish warning highlighted in recent coverage stems from concerns about market fragility. One analyst noted that despite the bounce, underlying conditions remain weak, with Bitcoin likely to test or break below November lows near $80,000. This view finds support in several areas. First, Bitcoin has underperformed equities significantly in Q4 2025, a historical signal that January strength may require further capitulation first.
More extreme voices, such as Bloomberg's Mike McGlone, maintain a long-standing bearish stance, forecasting potential declines toward $10,000 in 2026 if risk assets broadly correct. While such targets appear outlier given current fundamentals, they underscore the range of outcomes in volatile markets. Closer-term analysts point to bearish flag patterns and liquidation cascades as risks that could drive prices toward $80,000 or lower if macro data disappoints.
On-Chain Metrics: Mixed Signals from Whales and Holders
On-chain data provides nuance to the price action. Exchange reserves have declined modestly during the dip, suggesting holders are moving coins to cold storage rather than selling aggressively. Shark and whale addresses (holding 100-10,000 BTC) have accumulated at the fastest pace in years during the 30% drawdown, indicating conviction among mid-tier investors.
Realized price metrics show the average cost basis for short-term holders near $90,000, placing many underwater and increasing sell pressure on rallies. Long-term holders remain firmly in profit, with their cost basis around $45,000-$50,000. The MVRV ratio has reset to levels consistent with mid-cycle corrections, offering room for recovery—but also vulnerability if sentiment sours further.
Macro Factors and Policy Uncertainty
Bitcoin's price does not move in isolation. The Federal Reserve's December meeting delivered expected rate cuts but signaled a more hawkish path for 2026, disappointing markets hoping for aggressive easing. Higher-for-longer yields strengthen the dollar and pressure risk assets, including crypto. Upcoming data releases on inflation, employment, and retail sales will influence expectations heading into January.
Geopolitical tensions and regulatory developments add layers of uncertainty. While the broader adoption narrative remains intact, short-term liquidity conditions tied to traditional markets continue to dominate price discovery.
Historical Context: Corrections in Bull Markets
History offers perspective. Previous bull cycles featured drawdowns of 30-40% mid-rally, often lasting weeks to months before resumption. The 2021 cycle saw multiple 30%+ corrections before the final peak. Current conditions—elevated dominance, ETF maturation, and post-halving timing—echo mid-2021 more than cycle tops. Deep capitulation below $80,000 would challenge this analogy but remains within historical norms.
Market Outlook
Risks of Deeper Decline
A sustained break below $85,000 could trigger cascading liquidations, potentially driving Bitcoin toward $74,000-$80,000 quickly. Weak seasonal tendencies in December, combined with year-end profit-taking, increase downside risks. Persistent equity weakness or hotter-than-expected inflation data could accelerate the move.
Bullish Counterpoints and Recovery Scenarios
Not all signals are bearish. Oversold conditions, strong on-chain accumulation, and historical January strength provide counterarguments. A close above $90,000 this week could invalidate near-term bearish setups and target $95,000-$100,000 into year-end. Longer-term forecasts remain overwhelmingly positive, with many institutions targeting six figures by mid-2026.
Short-Term Outlook
In the immediate term, Bitcoin's fate hinges on holding $85,000-$86,000 support. Failure here opens the door to sub-$80,000 as warned by analysts. Success in defending these levels, coupled with improving macro data, could fuel a year-end rally toward $92,000+.
Long-Term Predictions
Despite near-term turbulence, the structural bull case remains intact. Limited supply, growing institutional adoption, and improving regulatory clarity support higher prices in 2026. Consensus targets cluster around $120,000-$150,000, though volatility will persist.
Conclusion
Bitcoin's bounce from Monday's lows offers temporary relief, but the market remains on edge. Technical breakdowns, macro pressures, and analyst warnings of sub-$80,000 keep bears in control for now. Investors should monitor key levels closely, manage risk, and remember that corrections are normal in bull markets. The coming weeks will clarify whether this is a healthy reset or the start of a deeper drawdown.
References:
CoinCatch Team
Disclaimer:
Digital asset prices carry high market risk and price volatility. You should carefully consider your investment experience, financial situation, investment objectives, and risk tolerance. CoinCatch is not responsible for any losses that may occur. This article should not be considered financial advice.