The cryptocurrency market is constantly evolving — it moves in cycles, with fluctuations at every turn. Understanding how to identify shifts in trends and make timely decisions can greatly enhance the profitability of your trades. Discover how to predict market movements using a practical, hands-on approach.
What Are Market Cycles?
Market cycles are repetitive stages that influence price movements in financial markets, including cryptocurrencies. These cycles consist of: the accumulation phase, where experienced traders purchase assets during times of low volatility; the acceleration phase (markup), characterized by a significant increase in demand and prices; the distribution phase, when key players realize profits in overbought situations; and the correction or bear cycle crypto (markdown), where prices fall due to substantial sell-offs and decreasing interest. Understanding these bitcoin market cycle phases enables traders to enter positions at the beginning of an uptrend and exit prior to the onset of a downtrend, thereby reducing risk and enhancing the effectiveness of their strategy.
How Crypto Market Cycles Work?
Cryptocurrency market cycles are recurring phases that the market undergoes over time, each with distinct characteristics and requiring different strategies for successful trading.
Accumulation Phase. During this phase, the market stays pretty steady, with prices moving up and down just a little. Big investors and "whales" start buying more assets, taking advantage of the low prices. Overall, public interest in cryptocurrencies is still not very high, and many people in the market aren't sure what the future holds for growth.
Growth Phase. After the accumulation phase, prices suddenly start to rise quickly as more people want to buy. More investors join in, and buying becomes stronger. Prices jump up fast, and the market begins to trend upward. This is the best time for traders who get in early during the growth phase to make good profits.
Distribution phase. At this point, big players start to sell off their assets to lock in their gains, which increases the amount of assets available in the market. This can cause the rise in prices to slow down and lead to some ups and downs. The market begins to settle, and there are often indications that prices might decrease. Many traders, not realizing this is happening, keep their holdings and hope prices will keep going up.
Decline phase. Eventually, a correction phase sets in, when demand begins to fall and crypto prices decline. This can be caused by panic selling, deteriorating market sentiment, or a general decline in interest in cryptocurrencies. At this stage, the market usually experiences a bearish trend, and many investors decide to exit, losing money.
Why Market Cycles Are Important?
All experienced traders have strategies that they use to take advantage of current price action. Many traders use the Elliott wave principle when making their trades. The Elliott wave principle is a form of technical analysis that is used in order to analyse financial market cycles. Traders forecast market trends by identifying highs and lows in asset prices, extremes in investor sentiment, and other factors. This wave analysis concept is based on the principles that “every action creates an equal and opposite reaction.”
This means that if an asset’s price moves up or down, it will then be followed by a contrary movement. This price action is divided into trends, which show the main direction of the asset’s price, and corrections, which usually move against this trend.
Key Differences Between Cryptocurrency and Traditional Market Cycles
The cycles of the cryptocurrency market are distinct from those of traditional markets in several important ways, especially when examining crypto bull and bear market cycles. To begin with, cryptocurrencies exhibit high volatility, resulting in more dramatic and shorter market life cycles. Prices can change significantly within hours or days, while traditional markets, like stocks or bonds, usually see more gradual shifts. Additionally, the cryptocurrency market is less regulated, which leads to extreme price fluctuations and often results in speculative "bubbles." In contrast, traditional markets tend to be more stable due to robust regulations and considerable institutional participation. Lastly, cryptocurrencies are significantly affected by emerging technologies and innovations, such as updates to blockchain or the introduction of new tokens, which can swiftly change market cycles. Traditional markets, on the other hand, are not as directly influenced by such rapidly changing technological advancements.
Key Phases of the Crypto Cycle
Every cryptocurrency market goes through several distinct phases, each influencing the asset’s price.
-
Accumulation is the phase when the market is relatively inactive, with prices staying within a narrow range. During this time, “whales” strategically buy assets without drawing attention from the broader market. It’s a waiting period, where growth seems uncertain, and most participants are unsure about the market’s future direction.
-
Crypto bull market cycle — this phase marks the start of active price growth, drawing the attention of mass investors. The market becomes optimistic, with cryptocurrency prices rising rapidly, which fuels increased demand. For traders, this is the most profitable phase, as prices soar.
-
Distribution — during this stage, large players begin locking in profits by selling their assets, which leads to market saturation with supply. The market may stabilize or slow down, and many investors fail to recognize the signs that the bullish trend is coming to an end, leading to potential misjudgments.
-
Bear Market — this phase is characterized by declining prices as the market enters a bearish trend. Lower demand and massive sell-offs drive prices down, often causing panic among investors. Those who failed to exit in earlier phases face the risk of losses during this downturn.
What Drives the Crypto Market Cycle?
The cryptocurrency market cycle is influenced by several critical factors, including:
Macro Trends and External Factors — Global economic occurrences, such as financial crises, inflation, fluctuations in exchange rates, or overall economic recessions, can ignite heightened interest in cryptocurrencies as alternative investment options. Additionally, the market is shaped by geopolitical uncertainties and the growing appetite for digital assets as a safeguard against risk.
Regulatory and Technological Catalysts — Modifications in legislative measures and regulations surrounding the cryptocurrency market can lead to both price surges and declines. For example, the acceptance of cryptocurrencies as an official payment method in specific nations or the incorporation of blockchain technologies into financial infrastructures can greatly affect supply and demand dynamics. Conversely, prohibitions or strict regulations in certain areas may trigger a significant market decline.
Institutional Investor Participation — The increasing interest from major financial entities, including banks, hedge funds, and investment firms, along with formal announcements from significant players regarding their intentions to invest in cryptocurrencies, typically results in enhanced liquidity and price appreciation. The participation of institutional investors contributes to market stability and can affect the length of bullish or bearish trends, thereby influencing long-term price trajectories.
Analysing Historical Market Cycles
The cryptocurrency market exhibits cyclicality due to several factors, including halving events, fundamental occurrences, and technical indicators.
Halving
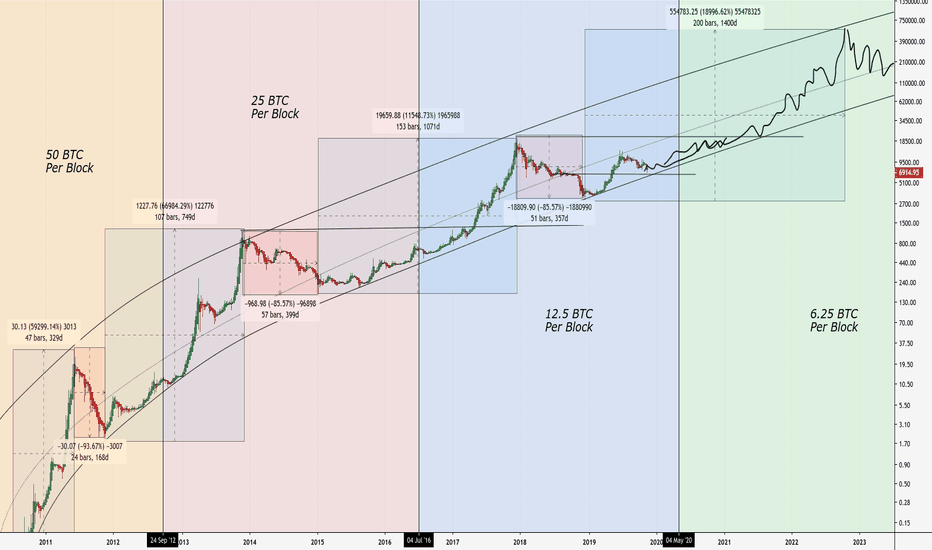
Halving is an event that takes place approximately every four years, during which the reward miners receive for mining a block is cut in half. This reduction in rewards leads to a decrease in the rate of new coin issuance, which, all else being equal, can drive up the value of the asset. Historically, after halving events, the price of
bitcoin has tended to rise, a trend supported by the Stock-to-Flow (S2F) model, which compares the current supply of an asset to its annual supply.
The chart below illustrates Bitcoin’s price movement following each halving event:
Bitcoin growth cycles after halving. Source: TradingView
Impact of Trending Events
Fundamental events, such as news about cryptocurrency regulation, political statements, or economic crises, can have a significant impact on the market. For instance, in June 2025, the US Senate passed
the GENIUS Act, which regulates
stablecoins, boosting confidence in cryptocurrencies backed by fiat currencies. This legislative move helped stimulate institutional interest, contributing to the growth of the cryptocurrency market. As a result, the market capitalization of stablecoins reached a record $251.7 billion.
Technical Indicators
Technical analysts use various indicators, such as the Relative Strength Index (RSI) and Simple Moving Averages (SMA), to assess whether an asset is overbought or oversold. These tools help predict potential trend reversals and identify optimal moments to enter or exit the market. Additionally, patterns like “head and shoulders” or “double top” can be used to pinpoint likely trend changes, enhancing decision-making strategies.
Progress of Cryptocurrency Cycles
Over time, the cryptocurrency market has evolved. In its early years, market dynamics were highly speculative and prone to sharp fluctuations. However, with the growth of institutional investment and the emergence of new technologies like DeFi, the market has matured and become more stable. Despite this progress, the cyclical nature driven by halving events and other factors remains an essential feature of the market.
How to Identify Crypto Cycle Phases?
To effectively determine the current phase of the cryptocurrency market, it is crucial to consider various factors. For instance, during the accumulation phase, prices tend to remain stable with low trading volumes, whereas in a bull market, one can witness rapid price increases and a notable rise in interest from new investors. As the distribution phase commences, the market experiences heightened volatility, and major players begin to realize profits, which may signal the initial signs of a correction. In a bear market, prices typically decline, leading to panic among investors, which signifies the conclusion of the bullish trend. These insights are essential for a deeper understanding of trading market cycles and for adjusting your strategy accordingly.
Key Tools and Indicators
To effectively analyse the cryptocurrency market, it is essential to use a combination of key tools and indicators that can provide insights into price trends, market sentiment, and volatility.
Technical analysis indicators:
Moving averages (SMA, EMA): Moving averages help smooth out price fluctuations and highlight long-term trends. For example, when a short moving average crosses a long one (from bottom to top), this may signal the start of a bullish trend.
Relative Strength Index (RSI): The RSI indicator shows whether an asset is overbought or oversold. A value above 70 indicates overbought (potential sell), below 30 indicates oversold (potential buy).
MACD (Moving Average Convergence Divergence): This indicator helps determine the direction of the trend, its strength, and possible reversals. When the MACD line crosses the signal line, it may indicate the start of a new trend.
Trading volume:
Trading volume is one of the most important indicators because it helps to assess the strength of price movement. For example, if the price of a cryptocurrency is rising on high volume, this indicates strong support for the trend. If the rise occurs on low volume, it may be a false signal that does not support real interest.
Sentiment analysis:
Social media and news feeds: Monitoring news and analysing conversations on platforms like X, Reddit, or Telegram aids in assessing the general market sentiment. For instance, if conversations strongly favor the rise of a cryptocurrency, it could suggest potential future demand.
Fear and greed index: This metric gauges market psychology by reflecting the levels of fear or greed among participants. Elevated values signify greed, which might foreshadow a market correction, whereas diminished values represent fear, potentially indicating a trend reversal.
Volatility analysis:
Bollinger Bands: This indicator displays volatility on a chart using bands that narrow or widen depending on price fluctuations. When the bands widen, it can mean high volatility and a possible trend reversal.
Average True Range (ATR): ATR measures volatility based on the difference between closing prices and the lows/highs of candlesticks. An increase in ATR indicates an increase in volatility.
Trading and Investment Strategies for Market Cycles
To trade and invest successfully in bitcoin cycles, it is important to choose strategies that are appropriate for the current market phase.
Long-Term Holding with Dollar-Cost Averaging (DCA)
Dollar-Cost Averaging (DCA) is a method in which an investor regularly purchases assets for a predetermined amount, regardless of their current market price. This technique aids in reducing the effects of temporary market volatility and decreases the average cost of acquisition over time. Considering the cyclical characteristics of the cryptocurrency market, such as the Bitcoin four-year cycle, DCA proves to be an excellent strategy for long-term investors. It enables them to gather assets during both the accumulation phase and the bullish trends in cryptocurrency, while effectively disregarding short-term downturns.
Advantages of DCA:
Reduced risk of buying at the peak of the market.
Ease of implementation and management.
Ability to accumulate assets without the need to engage in active trading.
Swing and Trend-Following Strategies
Swing trading focuses on profiting from short-term price fluctuations. Traders employing this strategy aim to buy assets during correction phases (in bearish trends) and sell them at price peaks (in bullish trends). A key aspect of swing trading is the ability to identify trend reversals and use technical indicators to make informed decisions.
Trend Following Strategy
Trend following involves investing in assets that are showing a clear trend. Traders use indicators like moving averages to buy when the market is in a bullish trend and sell or reduce positions when the trend weakens.
Advantages of these strategies:
Potential for short-term profits.
Ability to use technical indicators for accurate entries and exits.
Attracts active traders who want to take advantage of volatility.
Using Sentiment and Volume for Short-Term Trades
For short-term trades, monitoring market sentiment and trading volume is crucial, as these factors can provide insights into potential short-term price movements. Positive or negative news, social media discussions, and fear and greed indicators often serve as strong signals for decision-making. When combined with volume analysis, traders can gauge the strength of the current price movement. For instance, a significant rise in volume during a price increase may signal the start of a bullish trend, while higher volume during a price decline could indicate the market is in a correction phase or a bearish trend.
Advantages:
Quick response to market changes.
Shorter position holding periods, allowing you to profit from short-term fluctuations.
Conclusion
Analysing market cycles and phases remains indispensable for cryptocurrency trading and investing success. The defining phases—accumulation, bull market, distribution, and bear market—profoundly shape market behavior and strategic decisions. Proficiency in cycle recognition allows traders to foresee transitions, minimize exposure, and secure enduring success within this fluid market landscape.
Reference:
CoinCatch Team
Disclaimer:
Digital asset prices carry high market risk and price volatility. You should carefully consider your investment experience, financial situation, investment objectives, and risk tolerance. CoinCatch is not responsible for any losses that may occur. This article should not be considered financial advice.