The cryptocurrency market experienced significant fluctuations during the week of December 12 to December 18, 2025. The week began with consolidation, followed by a notable decline mid-week, and then a modest recovery towards the weekend. The total market capitalization ranged between approximately $2.90 trillion and $3.12 trillion, concluding the week at around $2.92 trillion, representing a net decrease of approximately 2-3%. Bitcoin, the leading digital asset, started the week above $90,000 but fell to multi-week lows near $85,000-$86,000 before recovering to approximately $86,800 by December 18.
Market Overview
BTC
:
Bitcoin dropped 3.91% over the week, now standing at $86,704.10. Bitcoin entered the week in a consolidative mode, trading above $90,000 through December 12-13, with prices around $90,200-$92,500 early on. However, thinning liquidity and profit-taking accelerated selling pressure over the weekend and into Monday, pushing BTC below $86,000 for the first time in weeks. The mid-week low near $85,000-$86,000 marked a 30%+ retracement from October's all-time high above $126,000, triggering significant liquidations and oversold conditions. A relief rally emerged mid-week, supported by dip-buying and short covering, lifting BTC back toward $87,000-$88,000 by December 17. By December 18, Bitcoin stabilized around $86,800, posting a weekly decline of approximately 3-4% but showing signs of basing.
Technically, the week featured a breakdown from a descending channel, with support testing the 50-day EMA near $86,000. Oversold RSI readings below 30 on daily charts preceded the bounce, a pattern consistent with mid-cycle corrections. On-chain data revealed whale accumulation during the dip, while exchange reserves declined, suggesting reduced immediate sell pressure. Derivatives markets deleveraged, with open interest contracting and funding rates neutralizing.
ETH
: Ethereum dropped 10.99% over the week, now standing at $2,836.03. Throughout the week, Ethereum underperformed compared to Bitcoin, experiencing a decline of approximately 5-6%, closing near $2,840 to $2,900 as of December 18. The ETH/BTC ratio reached multi-month lows, indicating relative weakness and low activity on the base layer. Network metrics reflected ongoing dormancy: gas fees remained at historic lows, around 0.025 to 0.03 Gwei, facilitating inexpensive transactions but suggesting subdued demand in DeFi and NFT sectors. Daily active addresses and transaction volumes remained subdued, a trend observed following the Dencun upgrade, which has impacted revenue despite improvements in efficiency. Price-wise, ETH briefly fell below the $3,000 support level mid-week before experiencing a partial rebound. Institutional accumulation provided some underlying support; however, ecosystem fragmentation caused by Layer 2 solutions and the delay of key catalysts limited significant upside. Spot ETF flows were mixed, with some outflows, contrasting with occasional inflows seen in Bitcoin. The week highlighted Ethereum's current challenges in regaining narrative momentum, although prospects remain favorable in the longer term due to staking yields and upcoming protocol upgrades.
Altcoins: Altcoins generally underperformed, declining by approximately 5-10% on average as capital shifted toward Bitcoin. Bitcoin dominance increased to around 59.4%, indicating a trend toward “Bitcoin season.” The Crypto Fear & Greed Index remained in a “Fear” sentiment throughout the week, reaching a low of 22 on December 18. This period reflected increased market caution amidst the decline, with fear exceeding 30% of readings in recent months. Historically, such extreme sentiment levels have often been followed by market reversals.
ETF: Mid-week, spot Bitcoin ETFs experienced combined net inflows exceeding $450 million on certain days, primarily driven by prominent issuers such as Fidelity and BlackRock. Year-to-date, overall flows continued to be notably positive, although activity in December moderated compared to the peak levels observed in November. Ethereum ETFs encountered relatively subdued activity, with occasional outflows during the period.
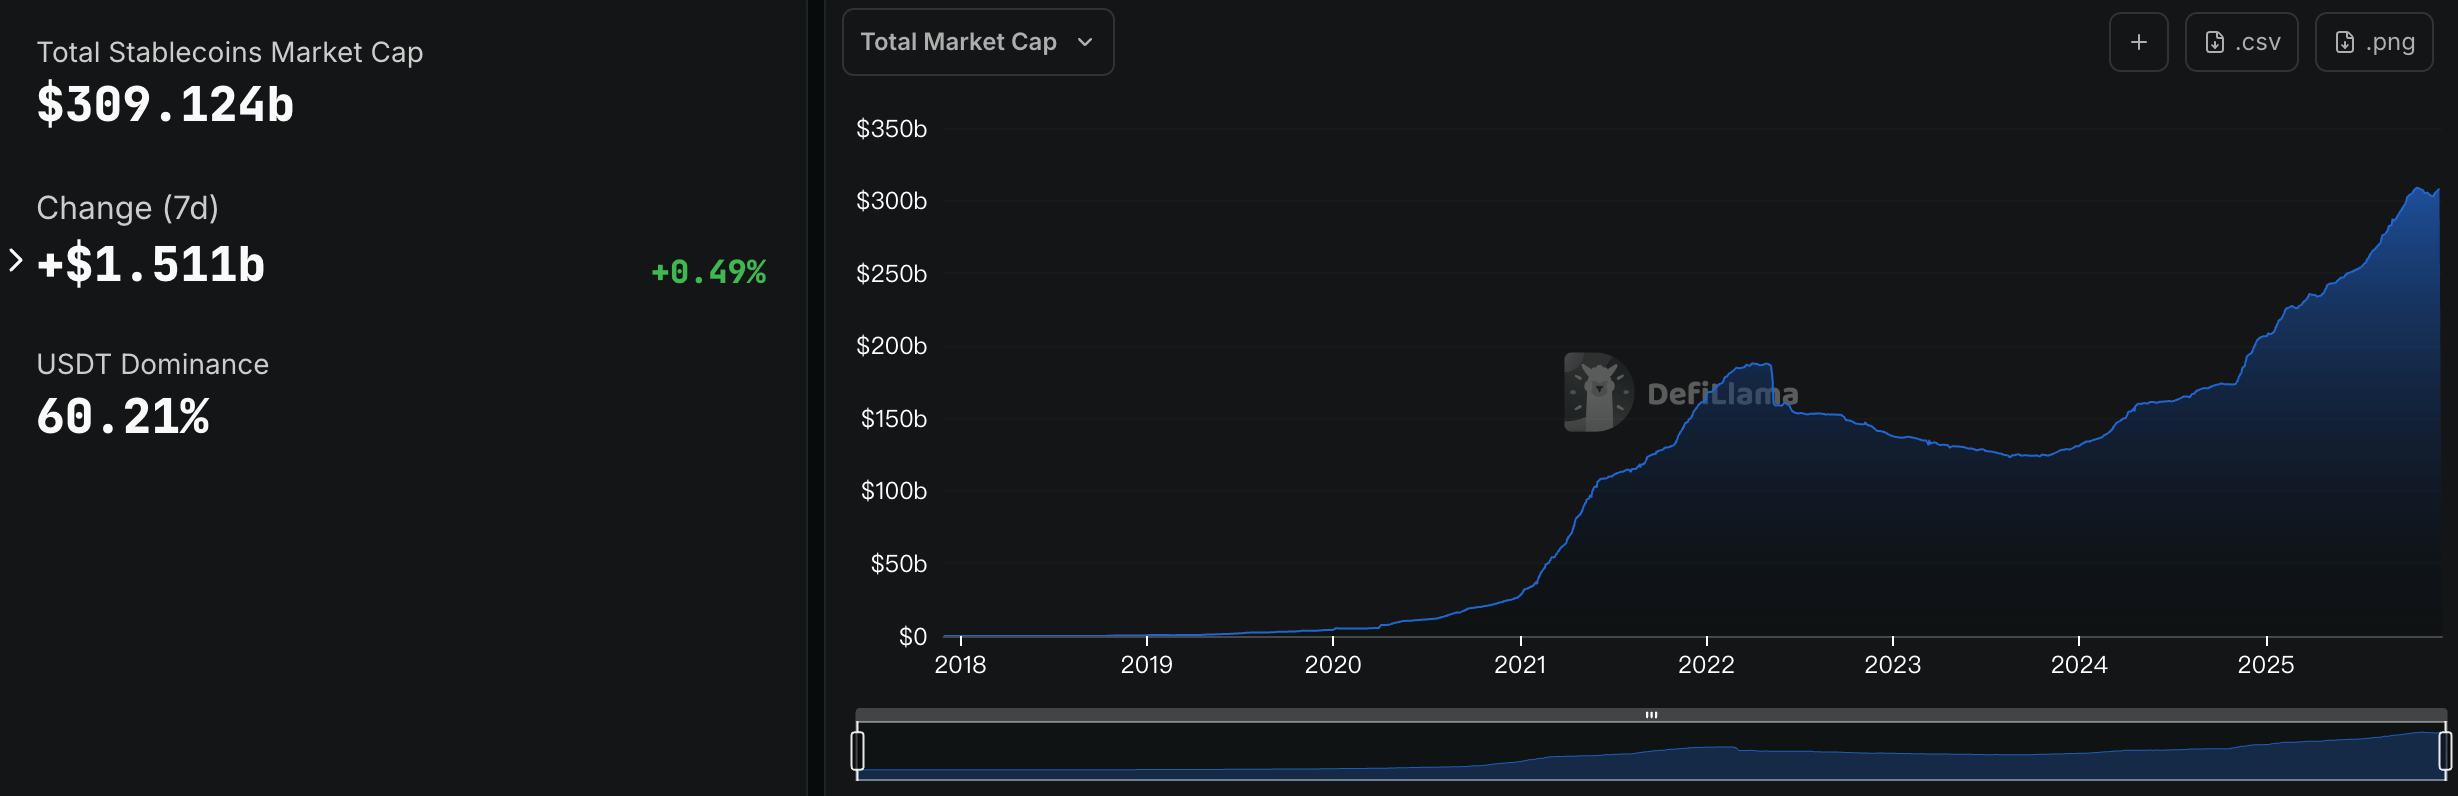
Stablecoins: Market capitalization increased by 0.49% week-over-week to $309.124 billion, with USDT accounting for $186.229 billion. USDC reached $77.977 billion. Tether and USDC continued to lead the market, accommodating outflows from risk assets and serving as a deployment reserve. The growth observed this year highlights the increasing maturity of stablecoins within crypto finance.
Stablecoins marketcap. Source: DefiLlama
Macro Data:
The global macroeconomic backdrop and the intrinsic liquidity of cryptocurrencies are creating a complex interplay. December's US CPI data showed persistent inflation, slightly delaying aggressive market expectations for the Federal Reserve's first interest rate cut and causing traditional risk assets to come under pressure. However, the cryptocurrency market demonstrated a degree of resilience.
The core positive signal comes from on-chain data: after 18 months of continuous contraction, the total supply of major stablecoins (USDT + USDC) has reversed course and begun to grow. Stablecoin supply is the most direct indicator of liquidity in the native cryptocurrency world, and its expansion means that new US dollar funds are flowing into the crypto ecosystem, providing the fundamental fuel for asset price increases. This change, combined with the external fiat currency inflow brought about by ETFs, creates an internal and external resonance, forming a solid foundation for this bull market, distinct from the purely leverage-driven bull market of 2021.
Meanwhile, the US dollar index (DXY) is hovering around 102.5, and the ten-year US Treasury yield remains stable at around 4.0%, a significant decrease from last year's highs. Although there is uncertainty regarding the precise timing of the Federal Reserve's policy shift, the market consensus is that interest rates have peaked, creating much more favorable financial conditions for non-interest-bearing growth assets like Bitcoin compared to last year's tightening cycle.
Gas Fees: Ethereum gas prices stayed at rock-bottom levels, averaging 0.025-0.035 Gwei with brief spikes during volatility peaks. This environment enabled essentially free transactions for basic transfers but highlighted sustained low demand for complex dApps. While beneficial for user adoption, prolonged lows delay revenue recapture and ecosystem momentum.
Weekly Market Focus
Hyperliquid (HYPE) Volume Declines as Traders Shift Attention to Lighter
This week, the number of daily active traders on Hyperliquid continued its downward trend, with approximately 167,000 active traders currently, a decrease of over 20% from the peak of over 210,000 reached in early November. This reflects the changing competitive landscape for Hyperliquid. As the decentralized perpetual futures market enters an accelerated expansion phase, more and more new platforms and established protocols are increasing their product and operational investments, competing for high-frequency traders and professional users through more aggressive fee reductions, trading incentives, market-making subsidies, and the rapid launch of new contracts. Hyperliquid's previously highly concentrated trading activity is now being marginally diluted. Meanwhile, against the backdrop of mainstream asset prices entering a high-level consolidation phase and declining short-term volatility, some active accounts that rely on volatility and funding rate arbitrage are choosing to reduce their trading frequency or temporarily migrate to other platforms with relatively higher funding rate volatility, further amplifying the decline in the number of active traders.
Of course, this does not mean that Hyperliquid has lost its competitiveness. To this day, Hyperliquid remains the on-chain protocol with the highest fee capture capability in the entire crypto market, excluding stablecoin issuers, and is still continuously conducting token buybacks. The current cooling of activity is more like a natural cooling and rebalancing for Hyperliquid in the context of increased industry competition. Its future performance will still depend on the speed of product iteration, the ability to maintain liquidity depth, and its continued attractiveness to professional traders in high-volatility market conditions.
Ripple Payments Lands First European Bank Client in AMINA
Ripple has secured its first European bank customer for its licensed payments stack, with Switzerland-based AMINA Bank adopting Ripple Payments to support near-real-time cross-border transfers for crypto-native clients, per a Friday release from the company.
AMINA, a FINMA-regulated digital asset bank, will use Ripple’s payments infrastructure to bridge traditional banking rails with blockchain-based settlement, a longstanding operational challenge for institutions servicing stablecoin issuers, crypto firms and tokenized asset platforms. The move signals a shift in how regulated banks are approaching crypto payments as an integrated business line — infrastructure that needs to work directly with fiat systems.
Ripple Payments is an end-to-end platform that combines messaging, liquidity sourcing and settlement across both fiat and blockchain rails.
Unlike correspondent banking networks, which rely on multiple intermediaries and batch settlement, Ripple’s system allows banks to move value directly, often settling transactions within minutes.
In practical terms, this means AMINA can process cross-border flows involving fiat currencies and stablecoins, including Ripple’s own RLUSD, without routing payments through multiple correspondent banks or relying on delayed clearing cycles.
Marshall Islands Launches World’s First Blockchain-based UBI on Stellar Blockchain
The Republic of the Marshall Islands (RMI) has completed the world’s first on-chain disbursement of universal basic income (UBI) using a digitally native sovereign bond, USDM1, via the Stellar blockchain.
Developed in partnership with the Stellar Development Foundation (SDF) and infrastructure provider Crossmint, the multimillion-dollar initiative is part of RMI’s national UBI program, known locally as ENRA, the Marshalls Islands’ Finance Ministry confirmed. The program replaces quarterly physical cash deliveries with direct digital transfers to eligible citizens, many of whom live across widely dispersed islands.
USDM1 is a U.S. dollar-denominated sovereign bond fully backed by short-term U.S. Treasury bills. The bond is distributed through the Stellar Disbursement Platform into a custom-built digital wallet app called Lomalo. Developed by Crossmint, Lomalo allows recipients to receive funds instantly via Crossmint wallets on the Stellar network.
The government emphasized that USDM1 does not compromise the country’s monetary or technological sovereignty. “ENRA is a fiscal distribution program, not a currency initiative,” the spokesperson said. “Every unit is issued one-to-one against short-dated U.S. Treasuries held in trust, fully backed and legally segregated at all times.”
A white paper released alongside the initiative outlines the broader policy and financial framework for USDM1.
Key Market Data Highlights
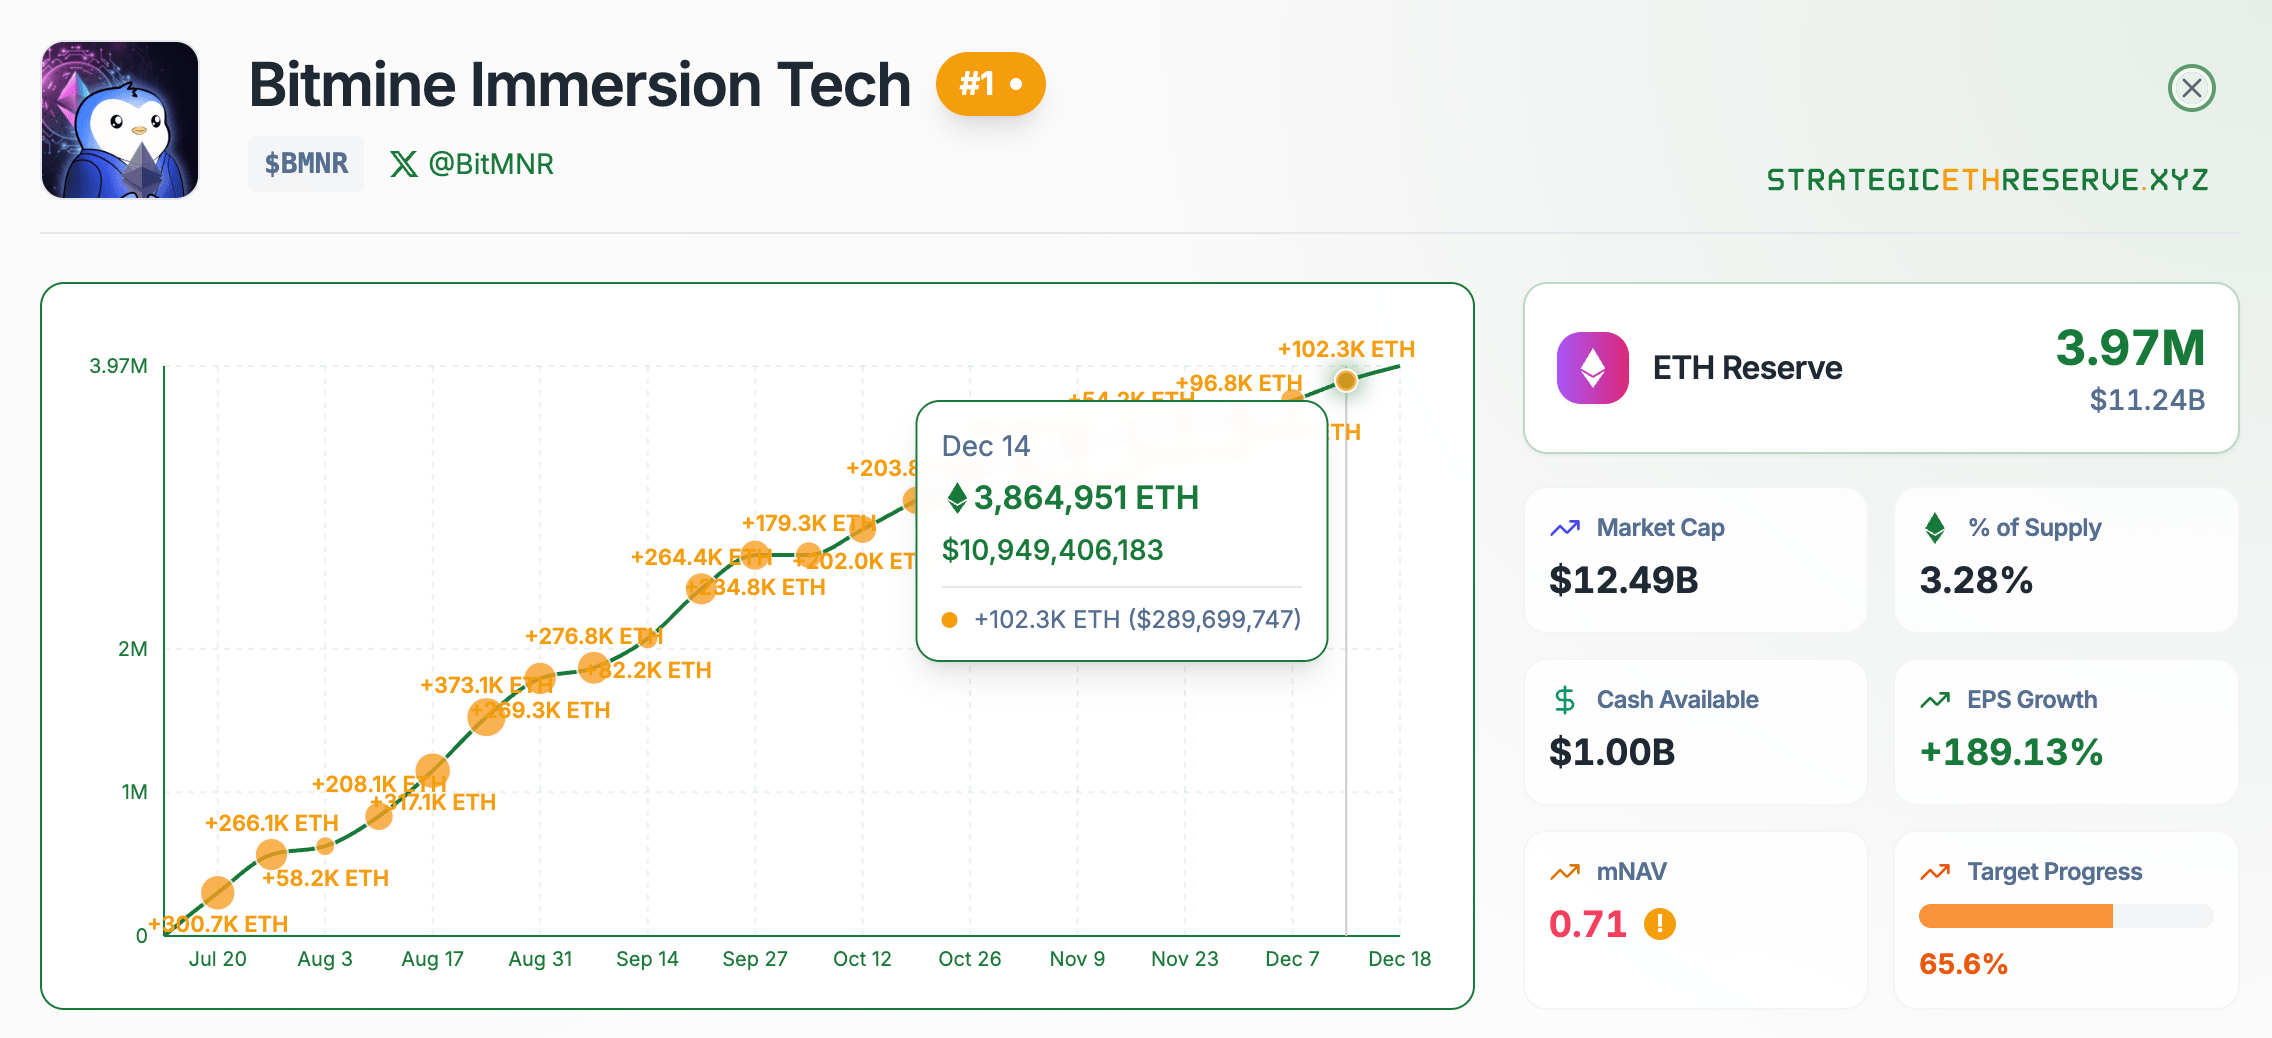
BitMine Immersion (BMNR) Announces ETH Holdings Reach 3.97 Million Tokens, and Total Crypto and Total Cash Holdings of $13.3 Billion
BitMine ETH Reserve Chart. Source: strategicethreserve.xyz
BitMine's total cryptocurrency and cash reserves amount to approximately $13.3 billion, including approximately 3,967,210 ETH (worth approximately $1.22 million), giving BitMine holdings exceeding 3.2% of the total ETH supply and putting it about two-thirds of the way towards its stated goal of acquiring 5% of the total ETH supply. In addition, BitMine holds 193 BTC, approximately $38 million in Eightco Holdings equity, and $1 billion in cash. This asset size makes BitMine not only the largest ETH treasury company but also the second-largest treasury company globally, second only to MicroStrategy.
In terms of short-term developments, BitMine increased its ETH holdings by another 102,259 ETH in the past week, continuing its long-term accumulation strategy despite the current unfavorable market conditions. BitMine Chairman Tom Lee stated that the improving fundamentals of the cryptocurrency market, against the backdrop of favorable digital asset legislation expected in the US in 2025, further strengthens the company's confidence in continuing to expand its ETH reserves. Beyond asset expansion, BitMine is also developing its own Ethereum staking solution, MAVAN, which is expected to be operational in early 2026, aiming to provide a better staking return mechanism for ETH holders.
Strategy's Total BTC Holdings Have Swelled to More Than 670,000 Coins
MicroStrategy, the world's largest corporate holder of Bitcoin, increased its BTC holdings again in the past week, purchasing a total of 10,645 BTC for approximately $980 million, at an average price of approximately $92,098 per coin. This brings MicroStrategy's total Bitcoin holdings to 671,268 BTC, representing a total investment of approximately $50.33 billion based on historical cumulative purchase costs, with an overall average holding cost of approximately $74,972 per coin. This makes MicroStrategy one of the most significant corporate Bitcoin reserve institutions globally.
Notably, this marks the second consecutive week that MicroStrategy has purchased over 10,000 BTC, demonstrating the company's management's confidence in the current market price and long-term investment value, while also addressing FUD (fear, uncertainty, and doubt) stemming from the recent decline in its stock price.
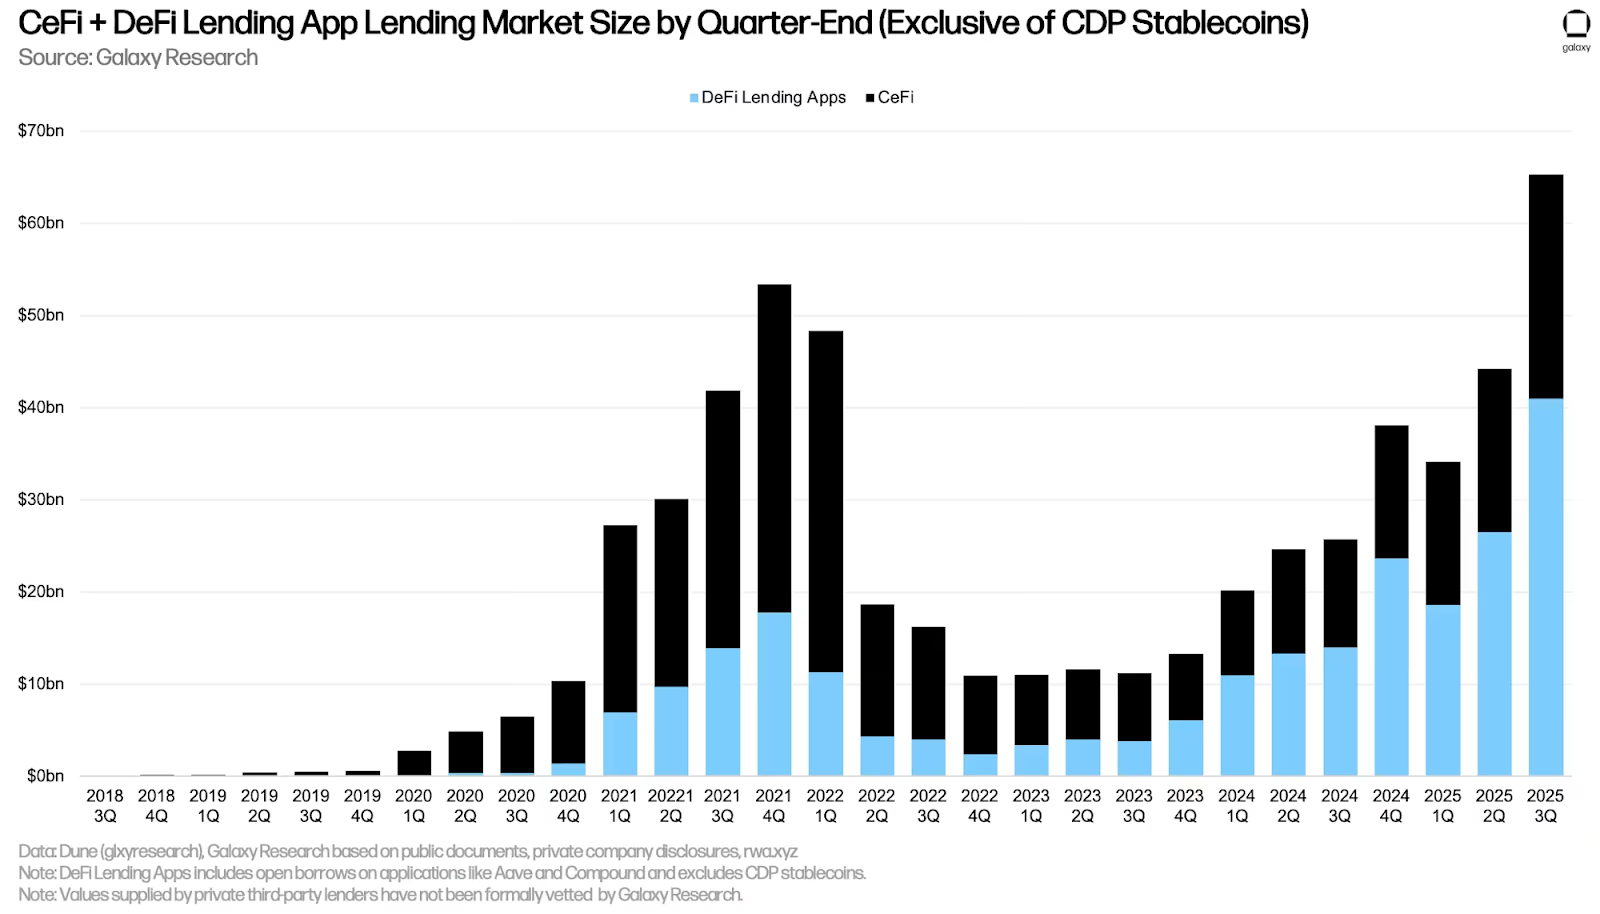
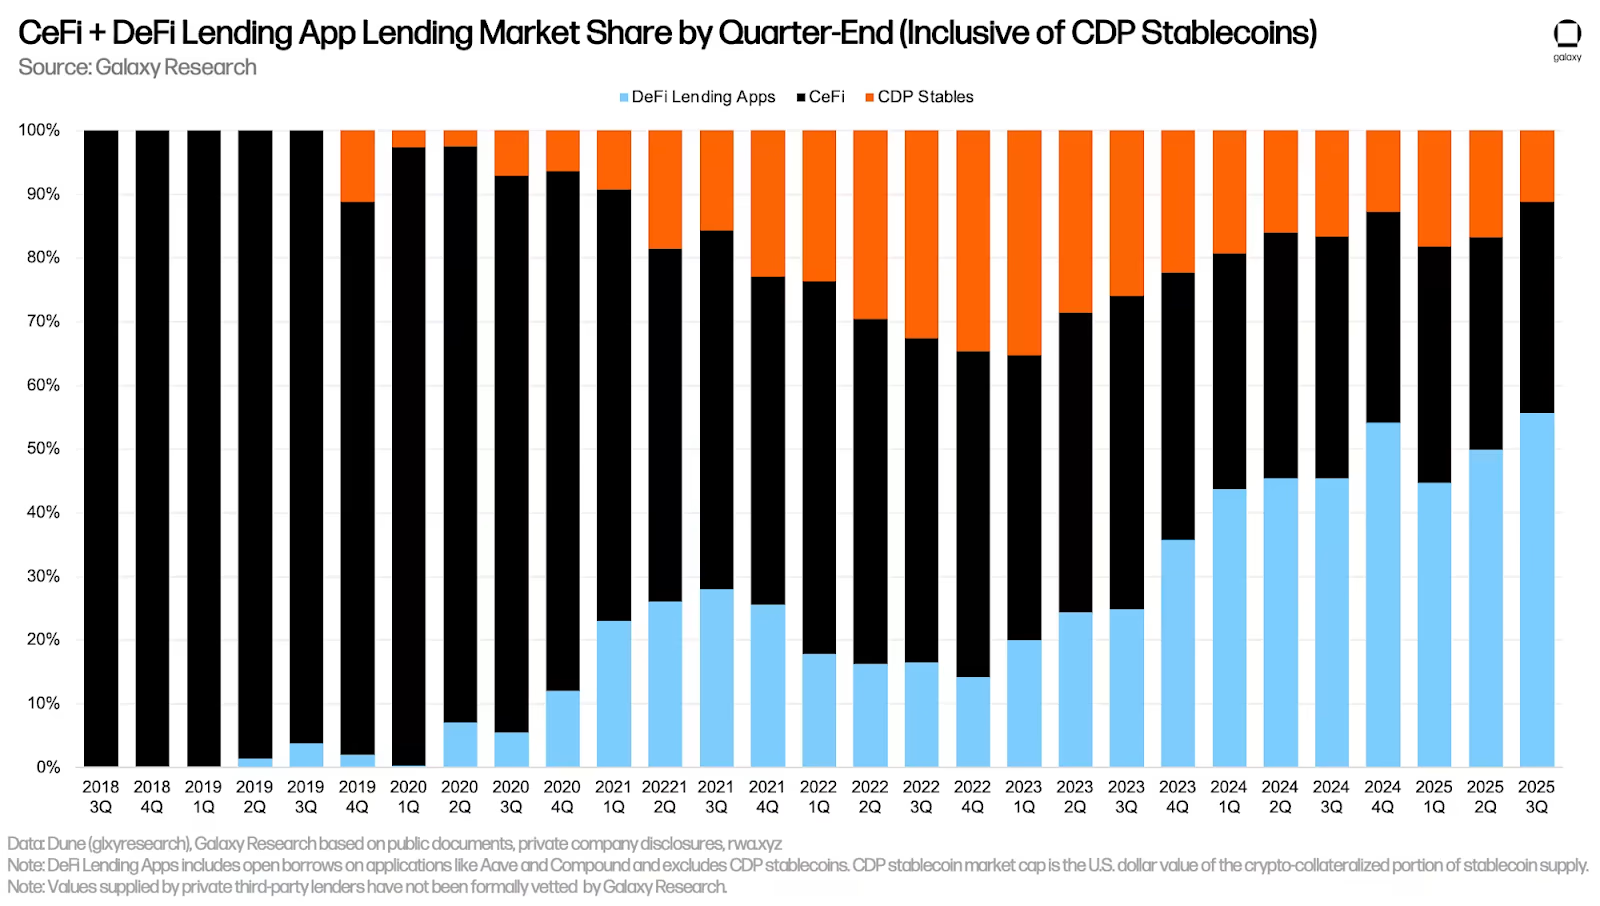
DeFi Lending Hit $41 Billion, A New Record in Q3 According Galaxy Digital Report
Lending in decentralized finance hit a new quarter-end high as the total active loans on DeFi applications neared $41 billion, Galaxy Digital said in its latest “State of Crypto” report for Q3. Galaxy’s research team wrote that DeFi borrowing grew by about $14.5 billion, or nearly 55% in the third quarter, alongside centralized crypto lending.
That growth helped push total crypto lending — across both DeFi and CeFi — to almost $73.6 billion, setting a new all-time high above the previous peak of $69.3 billion at the end of Q4 2021.
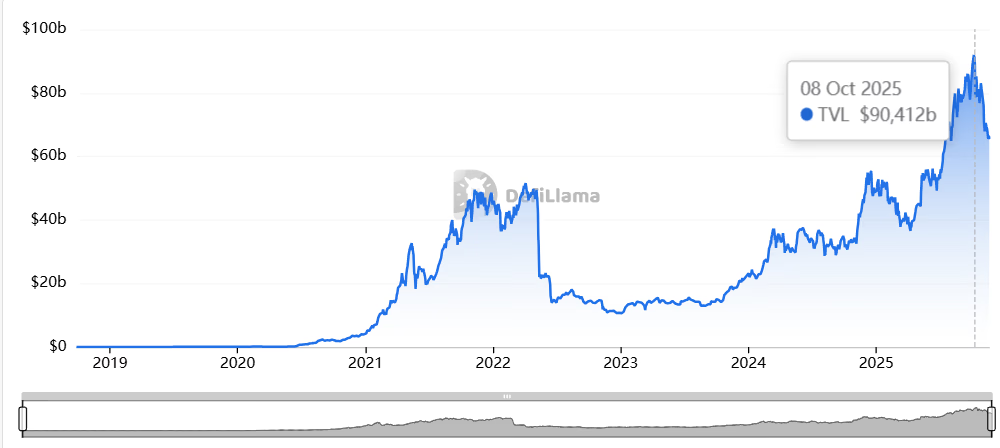
It’s worth noting that DefiLlama data shows that the total value locked in DeFi lending protocols was at around $90.9 billion as of early October.
Although TVL doesn’t necessarily reflect the amount actually borrowed from the protocols, if that $90 billion indeed held in early Q4, it could suggest that on-chain lending, combined with CeFi, was significantly higher than Galaxy’s Q3 snapshot.
A spokesperson for Galaxy Digital clarified that the wording about all-time high was meant “as of the end of Q3 2025,” which means that the historic maximum was likely reached in early Q4.
In the report, Galaxy Digital explained that several factors helped borrowing increase. Airdrops, points programs, better collateral products, and rising prices boosted users’ ability to borrow as the value of their collateral grew.
But Galaxy Digital also warned about possible double-counting between CeFi and DeFi numbers. As the report’s author, Galaxy research associate Zack Pokorny, wrote, some CeFi lenders borrow on-chain and then lend off-chain, which can show up twice without clear disclosures
Galaxy Digital also noted that while DeFi and on-chain CeFi lending numbers can be seen on the blockchain and are easy to access, getting CeFi data “is tricky” because of “inconsistencies in how CeFi lenders account for their outstanding loans and how often they make the information public.”
But still, combined, DeFi and CeFi loans totaled $65.3 billion at the end of Q3, up $21.1 billion from Q2, with most of the increase coming from DeFi. DeFi’s share of the market also grew, rising to 62.7% from 59.8% in the previous quarter.
In the weeks following Oct. 10 market crash, which resulted in record daily liquidations for crypto, the DeFi sector as a whole has struggled. The market shock in early November from the Balancer exploit, followed almost immediately by Stream Finance's collapse, further eroded trust in the sector. Total DeFi TVL has been down more than 25% since Oct. 10 to $125 billion, down from $170 billion.
CoinCatch Weekly New Listings:
CoinCatch Weekly Event
👑 Claim the Crown: Join King of Long & Short Challenge, Share $1M
📅Event Period: December 9, 2025 (UTC+8) - December 23, 2025 (UTC+8)
🥇 Event 1: Trading Competition – King of Long & Short Ranking
All profitable closed trades completed by users during the event will be recorded to calculate their
"Long & Short Points" — the core metric for rankings and rewards.
📊 Point Calculation Rules:
Single Trade Points = Single Trade Net Profit (USDT) × Direction Coefficient
Profitable Long Position: Direction Coefficient = +1
Profitable Short Position: Direction Coefficient = –1
Total Points = Sum of points from all profitable trades during the event
Long Position Net Profiter =
Positive total points
Short Position Net Profiter =
Negative total points
🏆 Reward Structure:
The "
King of Long & Short" Leaderboard, ranked by total positive points in descending order, is displayed below. Users must achieve a minimum trading volume of
50,000 USDT in futures trading to be eligible for ranking.
🎁 "Position Star" Special Leaderboards
✅
Long Position Star Leaderboard (Ranked by positive points):
1st Place: 1,000 USDT
2nd–5th Place: 200 USDT each
❌
Short Position Star Leaderboard (Ranked by negative points):
1st Place: 1,000 USDT
2nd–5th Place: 200 USDT each
🍀 Lucky Participation Award
Users who complete
at least 3 profitable trades during the event will automatically enter the random drawing pool. 200 lucky users will be selected randomly, with each winning 100 USDT!
🤝 Event 2: Invite Friends – Team Up for Bonus Rewards
Grab your
exclusive invitation link and invite friends to join! A friend counts as a "Valid Invitation" if they sign up via your link and complete
at least 1 profitable trade.
📈 Invitation Leaderboard
The top 10 users with the most valid invitations will each receive an additional
50 USDT reward!
100% Win Christmas Spins: Get Gaming Gear & $10M in Bonuses
📅 Event Time: 2025.12.18 (UTC+8) - 2025.12.24 (UTC+8)
✨ Limited-Time Offer:
-
Complete futures trading volume
≥ 100 USDT to get 1 lucky spin.
-
Complete a single deposit ≥
100 USDT to get 1 lucky spin.
-
Complete 1 share to get 1 lucky spin.
💎Complete more tasks below to earn up to
20 lucky spins! Win your exclusive Gaming Kits and bonuses worth 10,000,000 USDT.
Mission 1: Complete Deposits to Get Lucky Spins
-
Net deposit ≥
100 USDT held for 5+ days →
1 lucky spin
-
Net deposit ≥
1,000 USDT held for 5+ days →
+1 lucky spin
-
Net deposit ≥
5,000 USDT held for 5+ days →
+1 lucky spin
Mission 2: Futures Trading Volume Challenge
-
Futures Trading Volume ≥
10,000 USDT →
1 lucky spin
-
Futures Trading Volume ≥
50,000 USDT →
+1
lucky spin
-
Futures Trading Volume ≥
100,000 USDT →
+1 lucky spin
-
Futures Trading Volume ≥
200,000 USDT →
+1 lucky spin
-
Futures Trading Volume ≥
500,000 USDT →
+1 lucky spin
-
Futures Trading Volume ≥
1,000,000 USDT →
+1 lucky spin
-
Futures Trading Volume ≥
5,000,000 USDT →
+2
lucky spins
-
Futures Trading Volume ≥
10,000,000 USDT →
+3 lucky spins
-
Futures Trading Volume ≥
50,000,000 USDT →
+6 lucky spins
🎁 Rewards Explained
Prize pool includes:
-
PlayStation 5 Slim (Value: $500)
-
SONY 27” INZONE M9 II 4K 160Hz Full Array LED HDR Gaming Monitor (Value: $800)
-
Pulse Elite Wireless Headset (Value: $150)
-
DualSense Edge Wireless Controller (Value: $200)
-
PlayStation Plus 12‑Month Subscription (Value: $80)
-
30 XRP
-
Multi-denomination coupons (position bonus/trading bonus; total value $10,000,000)
Complete tasks to earn lucky spins - more tasks completed = more winning opportunities!
Token Unlocks Next Week
Tokenomist data indicates that from December 11 – December 17, 2025, several major token unlocks are scheduled. Some of them are:
ZRO will unlock approximately $33.68 million worth of tokens over the next seven days, representing 12.7% of the circulating supply.
HOOK will unlock approximately $10.23 million worth of tokens over the next seven days, representing 1.29% of the circulating supply.
The concentration of these unlocks within a single week created a supply overhang that further challenged altcoin prices. Historical analysis suggests that token unlocks, particularly those representing large percentages of circulating supply, often lead to price pressure as recipients take profits, especially in downward-trending markets. The scale of these unlocks, ranging from 1% to over 40% of market capitalization, presents a significant test for altcoin market liquidity and absorption capacity.
References:
CoinCatch Team
Disclaimer:
Digital asset prices carry high market risk and price volatility. You should carefully consider your investment experience, financial situation, investment objectives, and risk tolerance. CoinCatch is not responsible for any losses that may occur. This article should not be considered financial
advice.