The closing months of 2025 have presented Bitcoin investors with a stern test. After reaching unprecedented highs above $126,000 in October, the digital asset has undergone a severe correction, plummeting over 30% and erasing its yearly gains. This sharp downturn has plunged the market into a state of introspection, forcing a reevaluation of the drivers that fueled the historic bull run. The central question now gripping the market is whether this decline represents a healthy, albeit painful, correction within an ongoing bull market or the beginning of a more profound cyclical downturn. This article will dissect the anatomy of the recent sell-off, analyze the technical and fundamental signals for a potential bottom, explore the complex web of factors influencing Bitcoin's price, and synthesize divergent forecasts for its path forward.
Bitcoin Price Analysis: A Rollercoaster Year in Review
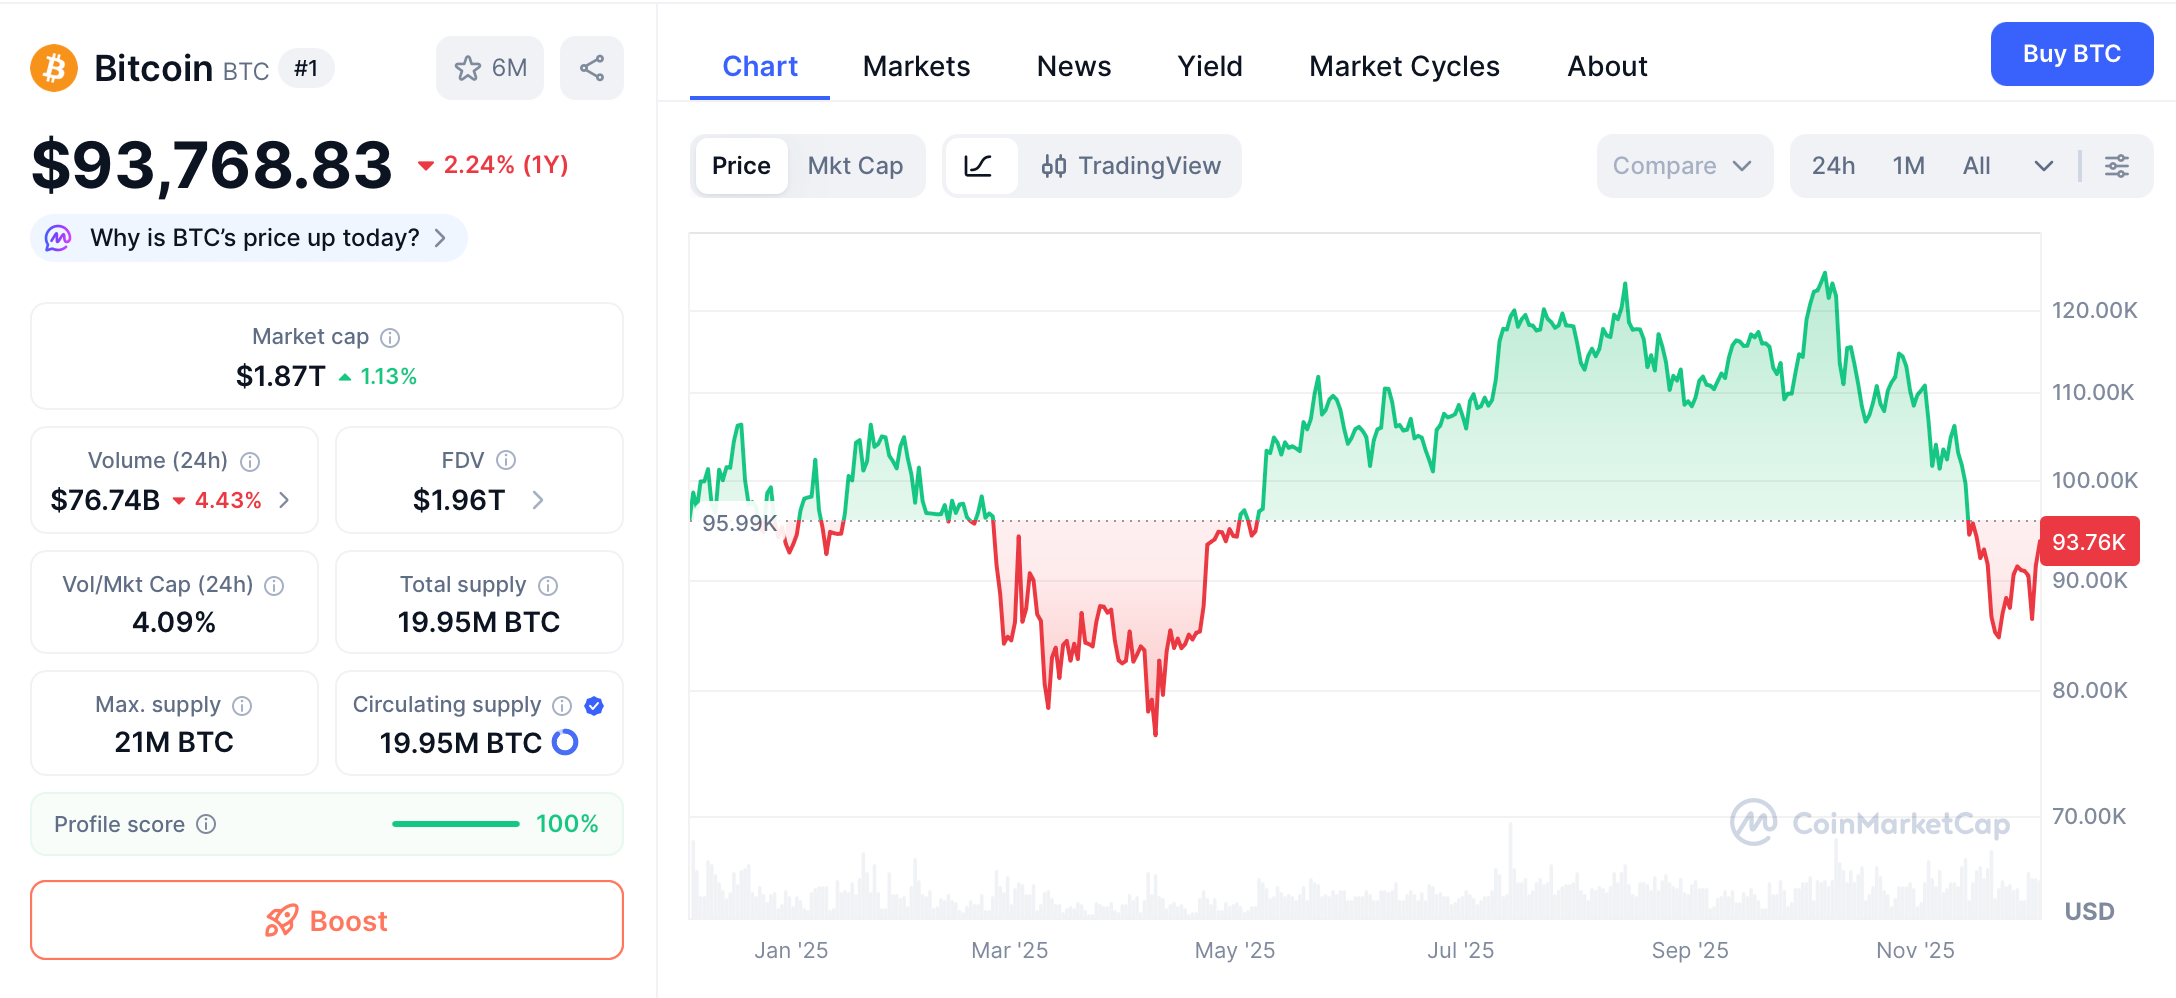
BTC price in the timeframe of a year. Source: CoinMarketCap
Bitcoin's 2025 journey has been a tale of highs and harsh corrections, reflecting the asset's inherent volatility while underscoring its growing maturity as a global store of value. The year began with cautious optimism, as BTC traded between $92,000 and $95,000 in January, buoyed by lingering post-halving momentum from April 2024. By February, it surged to an all-time high of $109,114 on January 20, driven by renewed ETF inflows and speculation around U.S. regulatory shifts under a pro-crypto administration. However, this euphoria proved short-lived. A heavy drop in February pushed prices toward $78,000, testing investor resolve amid whispers of overleveraged positions unwinding.
March and April brought a semblance of stability, with BTC consolidating above the 50-week exponential moving average (EMA), a key long-term support level. Yet, the real drama unfolded in the second half of the year. July marked a new all-time high above $112,000, smashing previous records and fueling predictions of a $175,000 year-end close. Institutional demand, particularly from spot Bitcoin ETFs, poured in billions, adding $1.79 trillion to BTC's market cap at its peak. Trading volume hit $78 billion in a single month—the highest since early 2025—signaling robust liquidity and confidence from hedge funds and corporations alike.
BTC ATH in October. Source: CoinMarketCap
October's "Uptober" rally saw BTC climb to $126,000, propelled by expectations of Federal Reserve rate cuts and geopolitical tensions that positioned Bitcoin as a hedge against fiat instability. But November shattered the narrative. A steep 17% decline erased much of the gains, with BTC dipping below $90,000 for the first time since April. This pullback aligned with historical patterns: Since 2010, Bitcoin has endured around 50 corrections exceeding 10%, averaging 30% drawdowns in bull markets. The November low of $80,600 raised alarms, as it broke key supports like the $100,000 psychological barrier and the upper border of a two-year ascending channel.
December opened with fresh pain. On December 1, BTC slid 8% to $83,824, triggering nearly $1 billion in leveraged liquidations across crypto exchanges. Ether followed suit, dropping 10% to $2,719, while smaller altcoins fared worse, with a MarketVector index for the bottom 50 of the top 100 tokens down 70% year-to-date. By December 3, however, a V-shaped recovery emerged, pushing BTC back above $90,000 and briefly touching $94,000. This snapback added intrigue, as the 7-day simple moving average (SMA) crossed above $90,234, and the MACD histogram flipped positive at +787, hinting at budding bullish momentum.
Technically, Bitcoin now trades in a high-volatility range between $84,000 and $94,000, with $86,000 acting as a pivotal support and $97,100 as overhead resistance. The daily chart shows a bear flag breakdown, suggesting potential extension to $66,800 if liquidity dries up further. Yet, the weekly timeframe remains constructive, with the 200-day moving average sloping upward since May. On-chain metrics paint a mixed picture: Realized losses have accumulated, but long-term holder behavior—typically a capitulation signal—has not fully shifted. Whale activity, including sales from "OG" holders with massive stashes, flooded supply in late November, but recent data shows coordinated buying from institutions at the $84,000 lows.
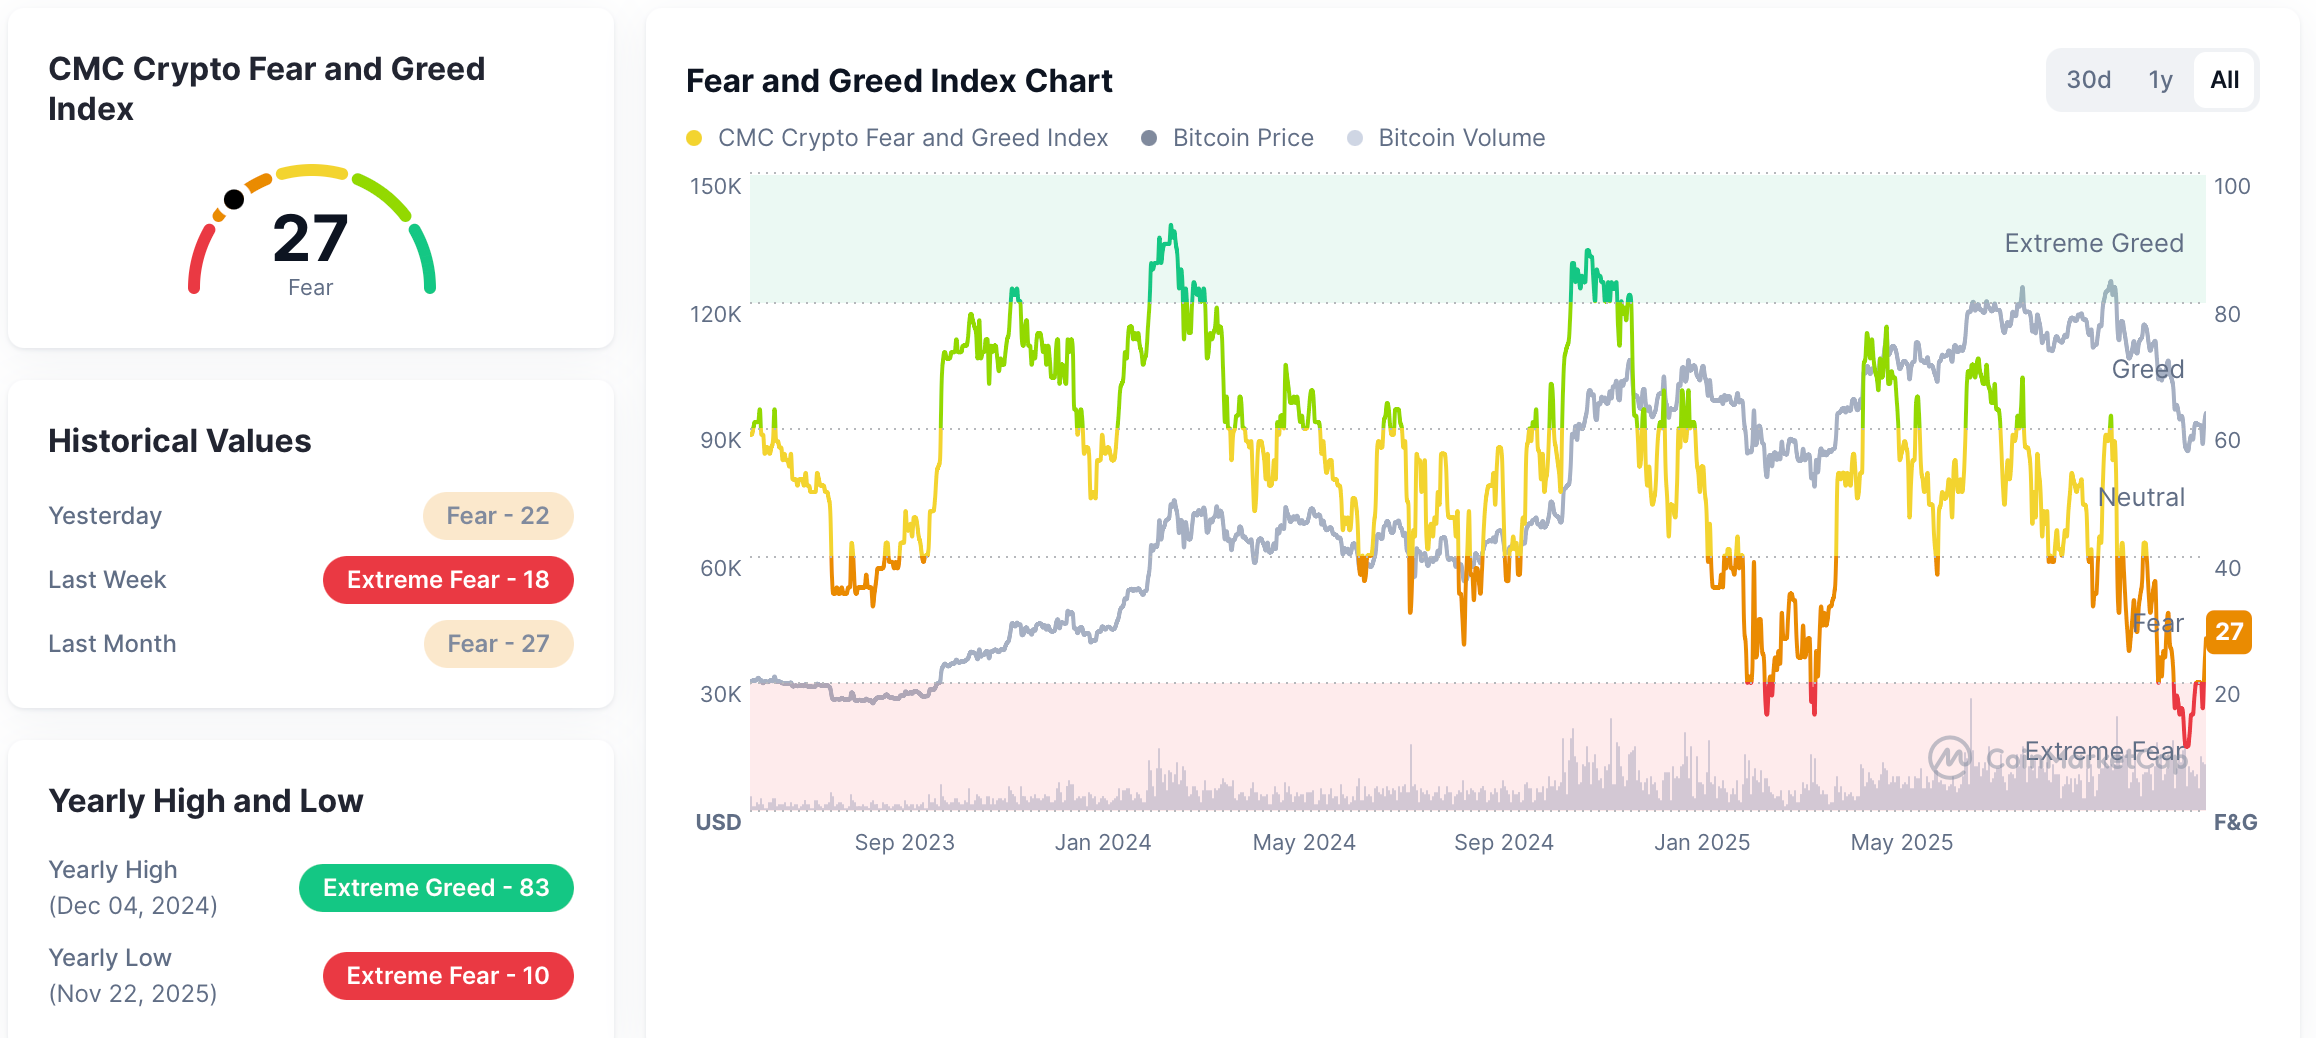
Fundamentally, Bitcoin's year-to-date performance sits at a 2% drop as of December 4, a far cry from the 35% surge seen mid-year. Compared to traditional assets, BTC lags the S&P 500's 16% rise but outperforms gold's flat trajectory amid inflationary fears. This divergence highlights Bitcoin's evolution from a speculative plaything to a high-beta macro asset, sensitive to yield spikes and risk-off sentiment. As December unfolds, a month historically yielding 9.7% average returns—traders eye whether this correction is a mid-cycle reset or the prelude to deeper woes. The Fear & Greed Index lingers at 27 (Fear), with only 37% green days in the last 30, underscoring the emotional pressure Bears are exerting early in the month.
Fear and greed index. Source: CoinMarketCap
In summary, 2025 has tested Bitcoin's resilience, blending explosive growth with punishing retreats. While the $83,824 low marked a psychological blow, the swift rebound to $93,000 suggests underlying strength. Yet, without confirmed support and sustained volume, the path forward remains fraught.
Why Did Bitcoin Price Jump After the Recent Sell-Off?
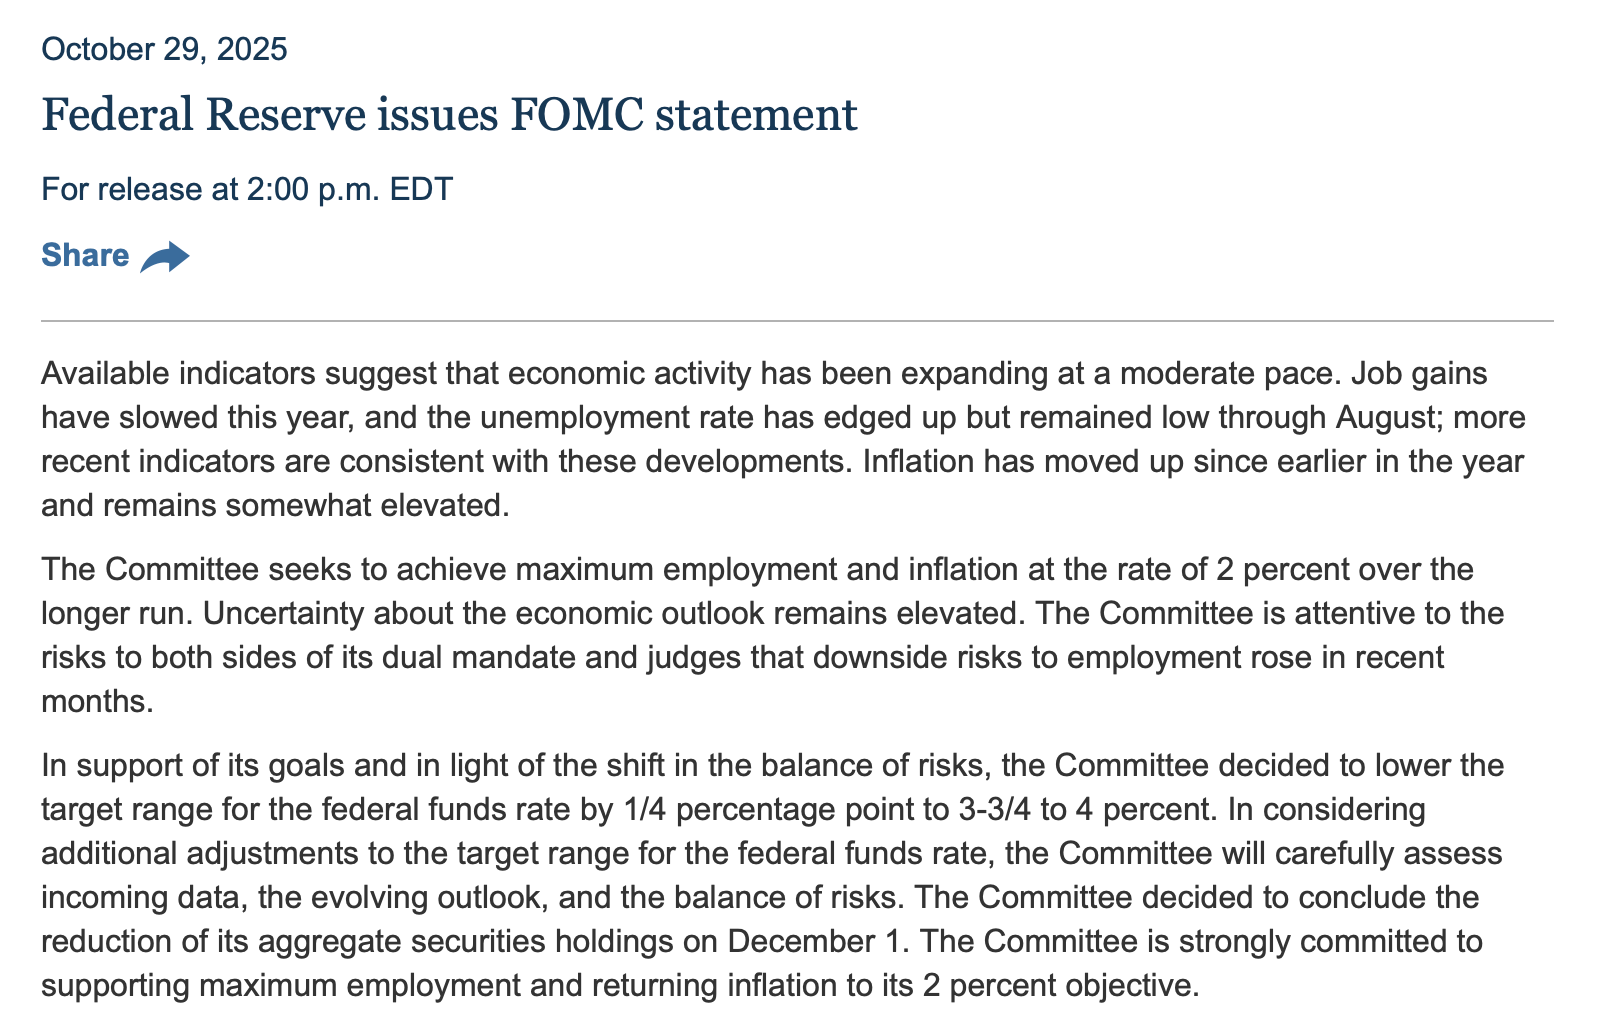
In late October and early November 2025, Bitcoin experienced a swift and sharp decline, falling from approximately $114,000 to briefly below $101,000. Any subsequent price jumps from these lows are best understood as technical rebounds or short squeezes within a dominant downtrend, rather than a definitive reversal. The primary catalyst for the original sell-off was a shift in macroeconomic expectations. The U.S. Federal Reserve, while delivering an expected rate cut on October 29, struck a surprisingly hawkish tone. Chair Jerome Powell indicated that a December rate cut was "not a foregone conclusion," which sharply reduced market expectations for continued monetary easing. This triggered a flight to safety, strengthening the U.S. dollar and pressuring all risk assets, including cryptocurrencies.
FOMC statement. Source: Federal Reserve
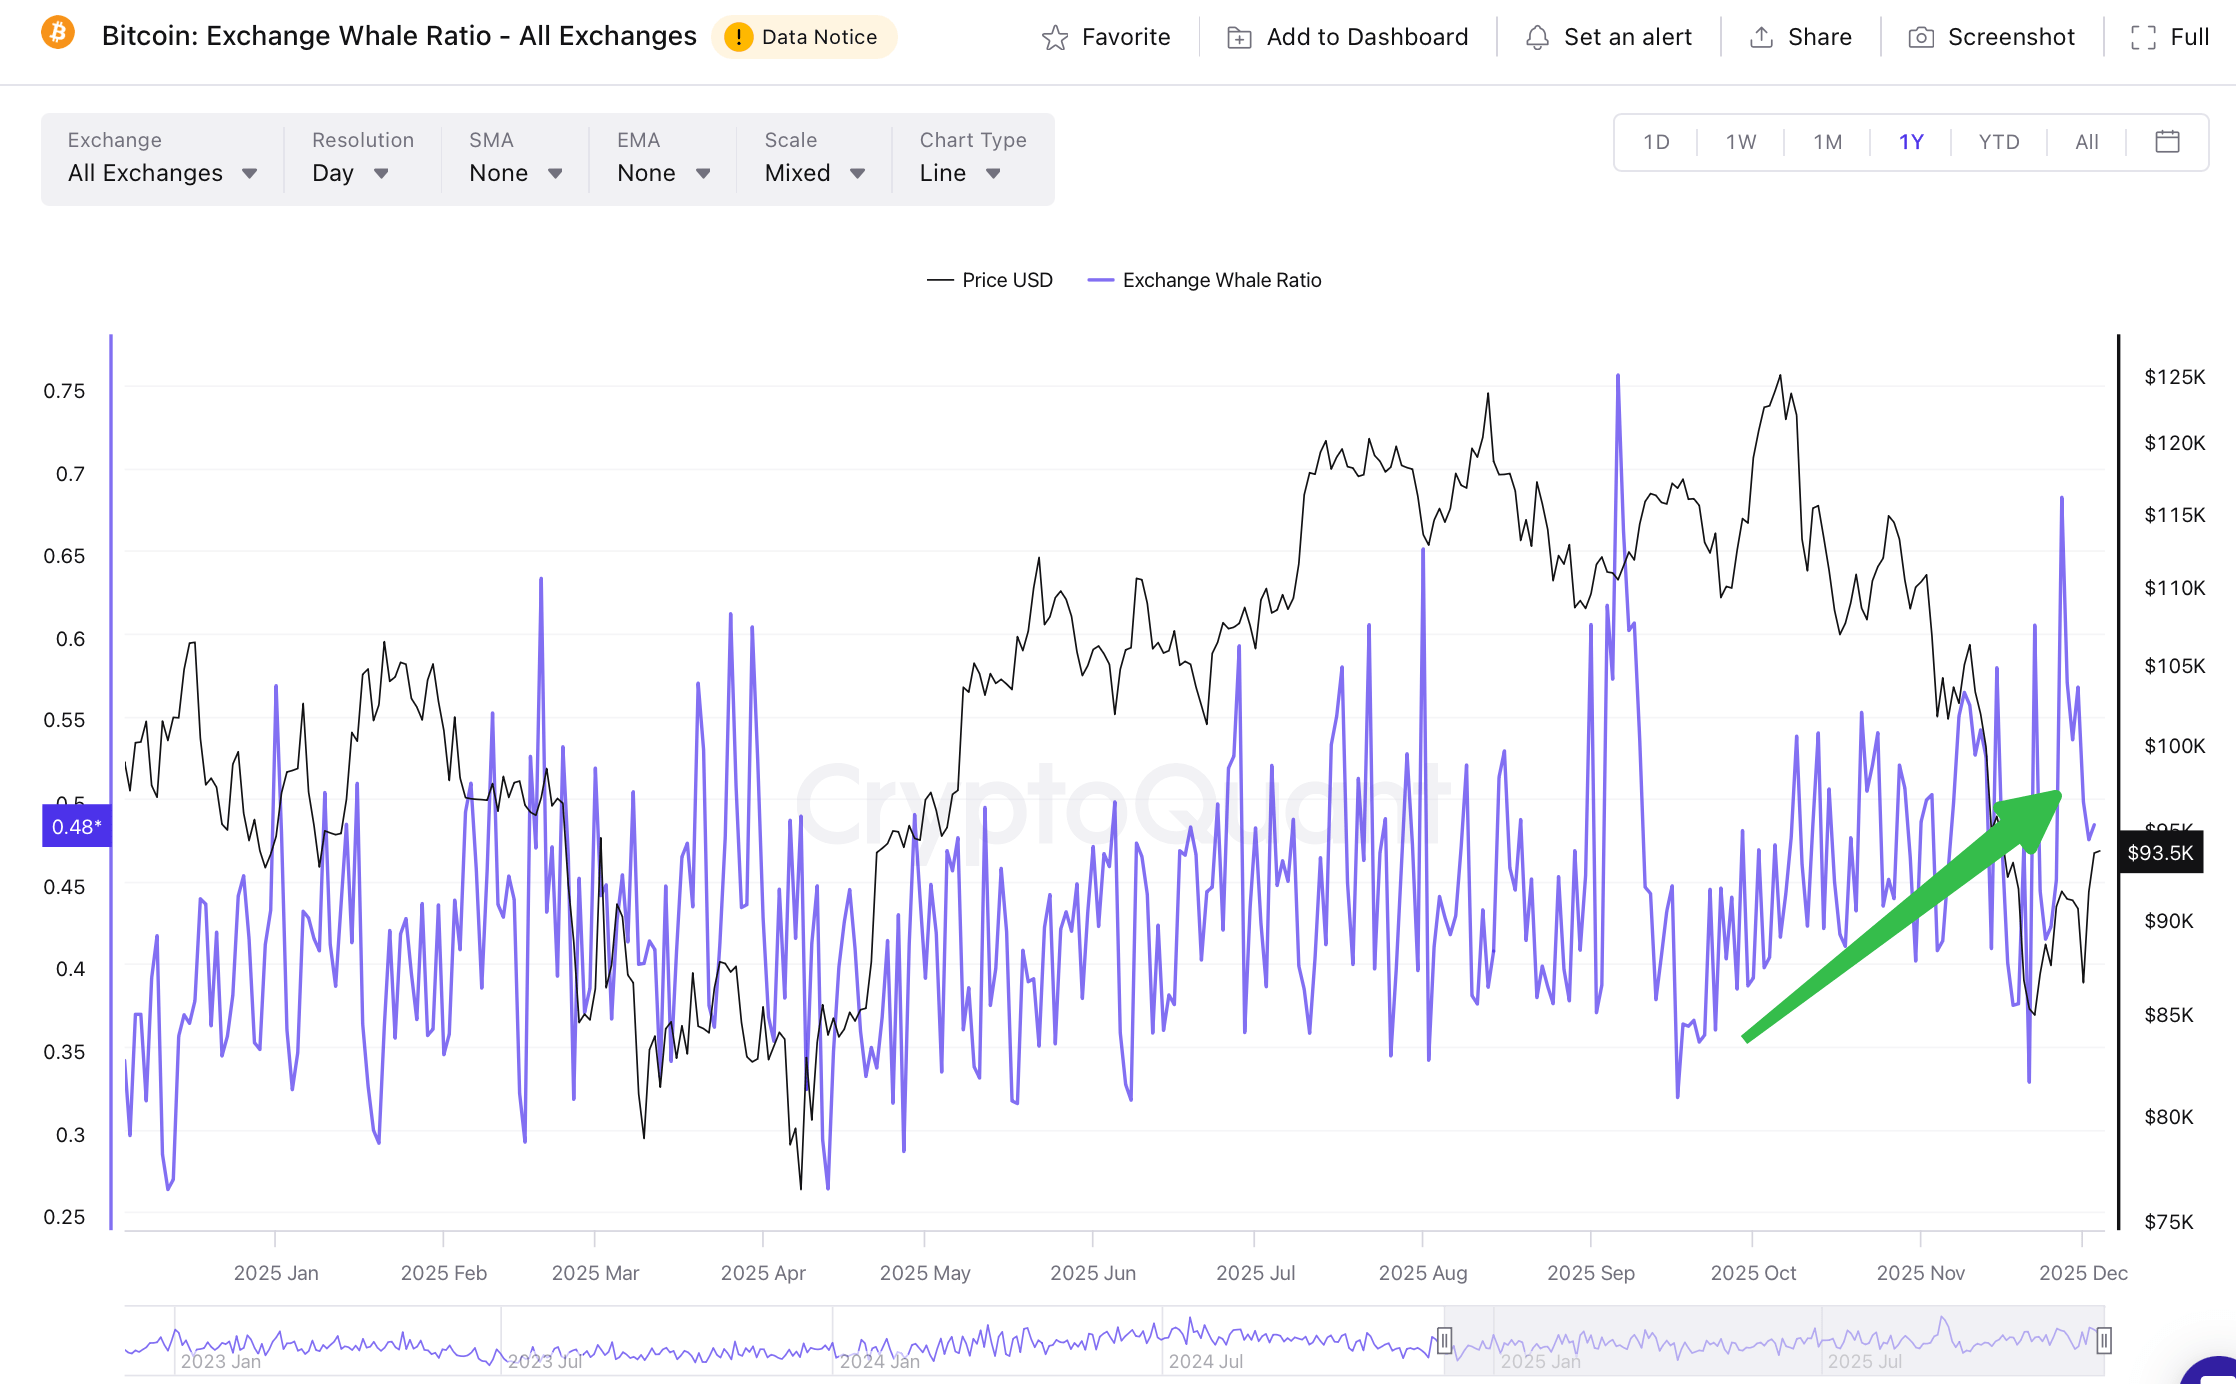
This macro shock exposed and exacerbated vulnerabilities within the crypto market's own structure. Large-scale distributions from long-term "whale" holders created significant selling pressure. For instance, a single 14-year-old dormant wallet moved 10,000 BTC (worth roughly $1 billion) to exchanges, while other early participants transferred billions more. This influx of supply overwhelmed buying interest. Concurrently, the derivatives market witnessed a violent unwind of leverage. As Bitcoin broke below key support levels like $106,000, it triggered a cascade of automatic liquidations, with over $400 million in leveraged long positions being forcibly closed in a 24-hour period. A rebound from such an oversold condition, fueled by short-term traders covering their positions, is a common market phenomenon and should not be mistaken for renewed bullish conviction.
Bitcoin: Exchange Whale Ratio. High values indicate whales are using the exchanges in large amounts. Source: CryptoQuant
Has Bitcoin Reached Its Bottom? Analyzing the Evidence
Determining a definitive market bottom is notoriously difficult, but several concurrent signals suggest Bitcoin is in a potential bottoming zone, though confirmation is still needed.
Arguments for a Bottom Forming:
-
Historical Pattern Alignment: The current drawdown of approximately 30% aligns with the average "bull market correction" of 25% that Bitcoin has historically experienced multiple times per year, rather than the multi-year "cyclical" bear markets. Grayscale Research notes this is the ninth significant pullback since the bull market began in late 2022.
-
Extreme Hedging Activity: Market sentiment has turned deeply cautious. A key indicator is the extreme skew in Bitcoin options, particularly for 3 to 6-month maturities, toward puts. This shows investors are paying high premiums to hedge against further downsides, a condition that often coincides with market fear and potential turning points.
-
Valuation Reset for Key Players: Public companies known for holding Bitcoin on their balance sheets, like MicroStrategy (MSTR), are now trading at a discount to the value of their crypto assets. This discount suggests speculative excess has been washed out and can precede a recovery.
Arguments Against a Confirmed Bottom:
-
Persistent Institutional Outflows: A pillar of the 2025 bull run has been institutional capital via spot Bitcoin ETFs. This support has faltered. These funds experienced cumulative net outflows of $1.15 billion in the week ending November 1, marking a significant shift from earlier sustained inflows.
-
Continued Selling from Long-Term Holders: On-chain data reveals that long-dormant Bitcoin continues to move to exchanges, indicating that early investors are still distributing their holdings, which maintain sell-side pressure.
-
Lack of Clear Catalysts: For a sustained rebound, the market needs a new narrative or catalyst. Current conditions are fragile, with negative news impacting prices while positive developments fail to generate momentum. Analysts at Caladan suggest Bitcoin may need to consolidate within a range, such as $83,000 to $95,000, to establish a base.
Key Factors Influencing Bitcoin's Price
Bitcoin's valuation is no longer driven by a single narrative but by a confluence of interconnected factors that have grown in complexity with its institutional adoption.
Institutional Capital Flows (The ETF Effect): The approval and performance of U.S. spot Bitcoin ETFs have fundamentally changed the market's plumbing. These funds acted as a massive conduit for institutional demand, with net inflows exceeding $144 billion by mid-2025. However, as evidenced in November, they can also become an exit channel. The current market weakness is directly attributed to the evaporation of this "reliable buyer". The future price trajectory is inextricably linked to the return of consistent ETF inflows.
Macroeconomic and Monetary Policy: Bitcoin's sensitivity to global liquidity conditions has increased. It is negatively correlated with the strength of the U.S. dollar (DXY). Hawkish central bank policy, which supports the dollar and raises real yields, creates a headwind. Conversely, expectations for Federal Reserve rate cuts were a major tailwind earlier in 2025. The market's next major catalyst could be the Fed's December meeting and its guidance for 2026.
On-Chain and Derivatives Market Dynamics: The internal mechanics of the crypto market are crucial. Large transactions by "whales" can signal distribution phases. Furthermore, the high degree of leverage in perpetual swaps and futures markets creates reflexive selling pressure during downturns through liquidation cascades. Monitoring exchange inflows, derivative funding rates, and open interest is essential to gauge market stress.
Regulatory Developments: Regulatory clarity, or the lack thereof, significantly impacts institutional participation. Progress on foundational legislation, such as a U.S. market structure bill for cryptocurrencies or stablecoin regulation, is viewed as a long-term positive that could unlock further investment.
Bitcoin Price Prediction: Diverging Views for 2025 and Beyond
The outlook for Bitcoin is polarized, reflecting the uncertainty of the current consolidation phase.
The Bullish Case: This view hinges on the belief that the structural adoption story remains intact and that the correction is a temporary setback.
-
Long-Term Institutional Targets: Despite recent volatility, major institutions have reiterated ambitious year-end targets. Analysts at Standard Chartered maintain predictions of Bitcoin reaching $200,000 by the end of 2025, arguing that strong ETF and corporate treasury buying will overcome traditional "post-halving" weakness. Unconfirmed reports also suggest SkyBridge Capital's Anthony Scaramucci has reaffirmed a $150,000 target.
-
Cycle Theory Rejection: Firms like Grayscale Research argue that the traditional four-year boom-bust cycle is breaking down. They posit that the lack of a parabolic "blow-off top" and the new inflow structure from ETFs justify an expectation for new all-time highs in 2026.
The Cautious and Near-Term View: This perspective focuses on the existing technical damage and the need for time to repair market sentiment.
-
Range-Bound Consolidation: Many traders and analysts expect a period of base-building rather than an immediate V-shaped recovery. Research predicts a trading range between $83,000 and $95,000 in the near term. Others warn that a break below the $75,000 support level could trigger a more severe sell-off.
-
Dependence on Macro Catalysts: The bullish trajectory is seen as contingent on supportive macro conditions. For prices to sustain a move toward $110,000-$135,000, the market would need clear confirmation of a Fed easing cycle and stable post-quantitative tightening liquidity.
Conclusion
Bitcoin stands at a critical juncture. The 2025 correction has been severe, driven by a perfect storm of hawkish macro pivots, institutional capital outflows, and violent leverage unwinds. The evidence suggests the market is engaged in a painful process of searching for a bottom, with indicators flashing both oversold signals and warnings of persistent selling pressure.
The central narrative has shifted. The question is no longer just about scarcity or digital gold, but about institutional commitment to a higher-for-longer interest rate environment and the resilience of the new ETF-driven market structure. While the long-term visions of $150,000 or $200,000 from institutional analysts remain, the near-term path is likely one of volatile consolidation between key support and resistance levels.
Investors should prepare for continued volatility. The market is wrestling with two opposing forces: the long-term, structural trend of financial digitization and institutional adoption, and the short-term cyclical pressures of capital rotation and monetary policy. The resolution of this tension will dictate whether the recent lows mark the foundation for the next leg up in Bitcoin's journey or a pause in deeper re-pricing.
Reference:
CoinCatch Team
Disclaimer:
Digital asset prices carry high market risk and price volatility. You should carefully consider your investment experience, financial situation, investment objectives, and risk tolerance. CoinCatch is not responsible for any losses that may occur. This article should not be considered financial advice.