The volume indicators provide valuable insights into the strength and sustainability of price movements, helping traders distinguish between genuine trends and mere market noise. While price action tells us what is happening in the market, volume reveals the underlying force behind these movements, the intensity of trading activity and the conviction of market participants.
Volume indicators measure the total number of coins or tokens traded within a specific timeframe, typically 24 hours in cryptocurrency markets. This data offers a window into market activity, liquidity, and the potential continuation or reversal of trends. For traders navigating the highly volatile crypto landscape, understanding volume indicators is not just advantageous, which is essential for developing robust trading strategies and managing risk effectively.
As cryptocurrency markets mature and institutional participation increases, volume analysis has become even more crucial for identifying "smart money" movements and detecting potential market manipulations. This article explores the importance of volume in trading, examines key volume indicators specifically relevant to cryptocurrency markets, explains how to interpret volume signals, and discusses the limitations and considerations of volume analysis.
The Importance of Volume in Trading
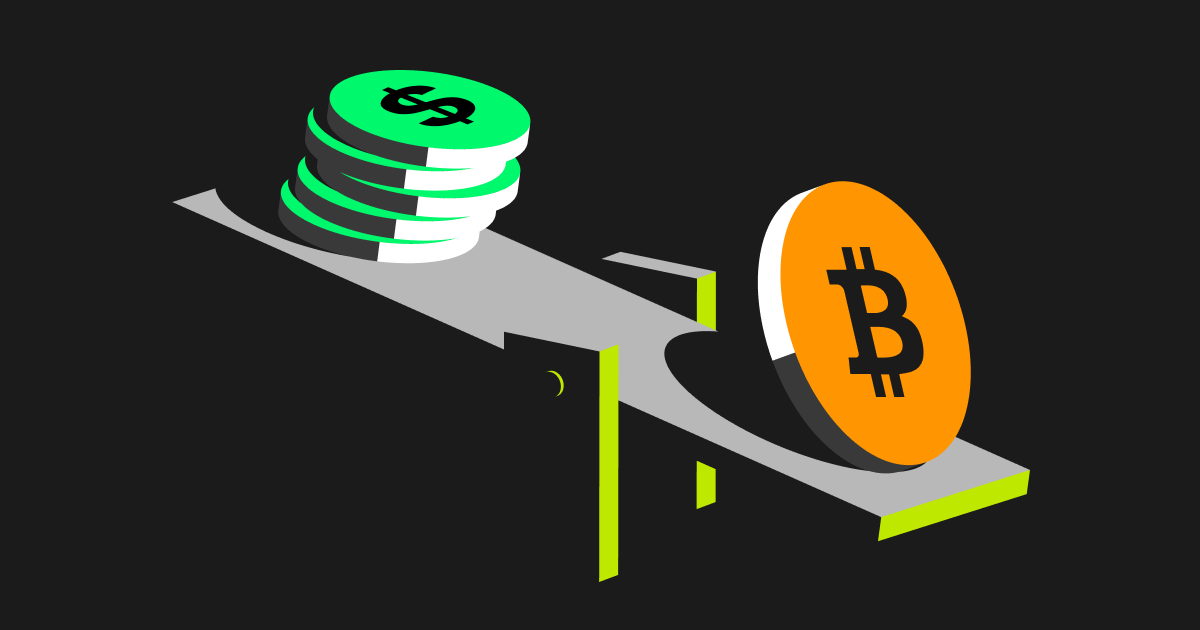
Volume represents the lifeblood of financial markets, and this is particularly true in the cryptocurrency space. At its core, volume measures the total number of coins or tokens traded within a specific period, providing a quantitative representation of market activity and liquidity. The significance of volume in trading stems from its ability to confirm trends, gauge market sentiment, and warn of potential reversals.
Volume as a Confirmation Tool
One of the primary functions of volume in technical analysis is its role in confirming price trends. When a price movement is accompanied by high volume, it suggests strong conviction among market participants, indicating that the trend is likely genuine and sustainable. Conversely, price movements on low volume often lack credibility and may reverse quickly, as they don't represent broad market participation. For instance, when prices rise with increasing volume, it signals robust buying interest and strengthens the case for a continued uptrend.
Market Sentiment Indicator
Volume provides unique insights into market psychology and sentiment. Periods of high volume typically reflect heightened interest, whether driven by fear, greed, or significant news events. In cryptocurrency markets, where sentiment can shift rapidly, volume acts as a barometer for the intensity of these emotional responses. Buying volume surges often indicate bullish sentiment, while high selling volume suggests bearish dominance.
Liquidity and Market Efficiency
Volume is directly correlated with market liquidity, the ease with which assets can be bought or sold without significantly impacting their price. High-volume cryptocurrencies typically have tighter bid-ask spreads and better order book depth, making them more attractive to traders and investors. Additionally, liquid markets tend to be more efficient, as information is quickly incorporated into prices through trading activity.
Institutional Participation
Volume analysis can help detect institutional involvement in cryptocurrency markets. Large players often accumulate or distribute positions gradually, leaving footprints in volume data that retail traders can identify. The presence of "smart money" (experienced institutional traders) often precedes significant market moves, making volume analysis a valuable tool for spotting these activities early.
Key Volume Indicators in Cryptocurrency Trading
While basic volume analysis provides valuable insights, specialized volume indicators offer more nuanced perspectives on market dynamics. These mathematical constructs filter and transform raw volume data into actionable signals, helping traders make more informed decisions.
Here are some widely used volume indicators in cryptocurrency trading:
-
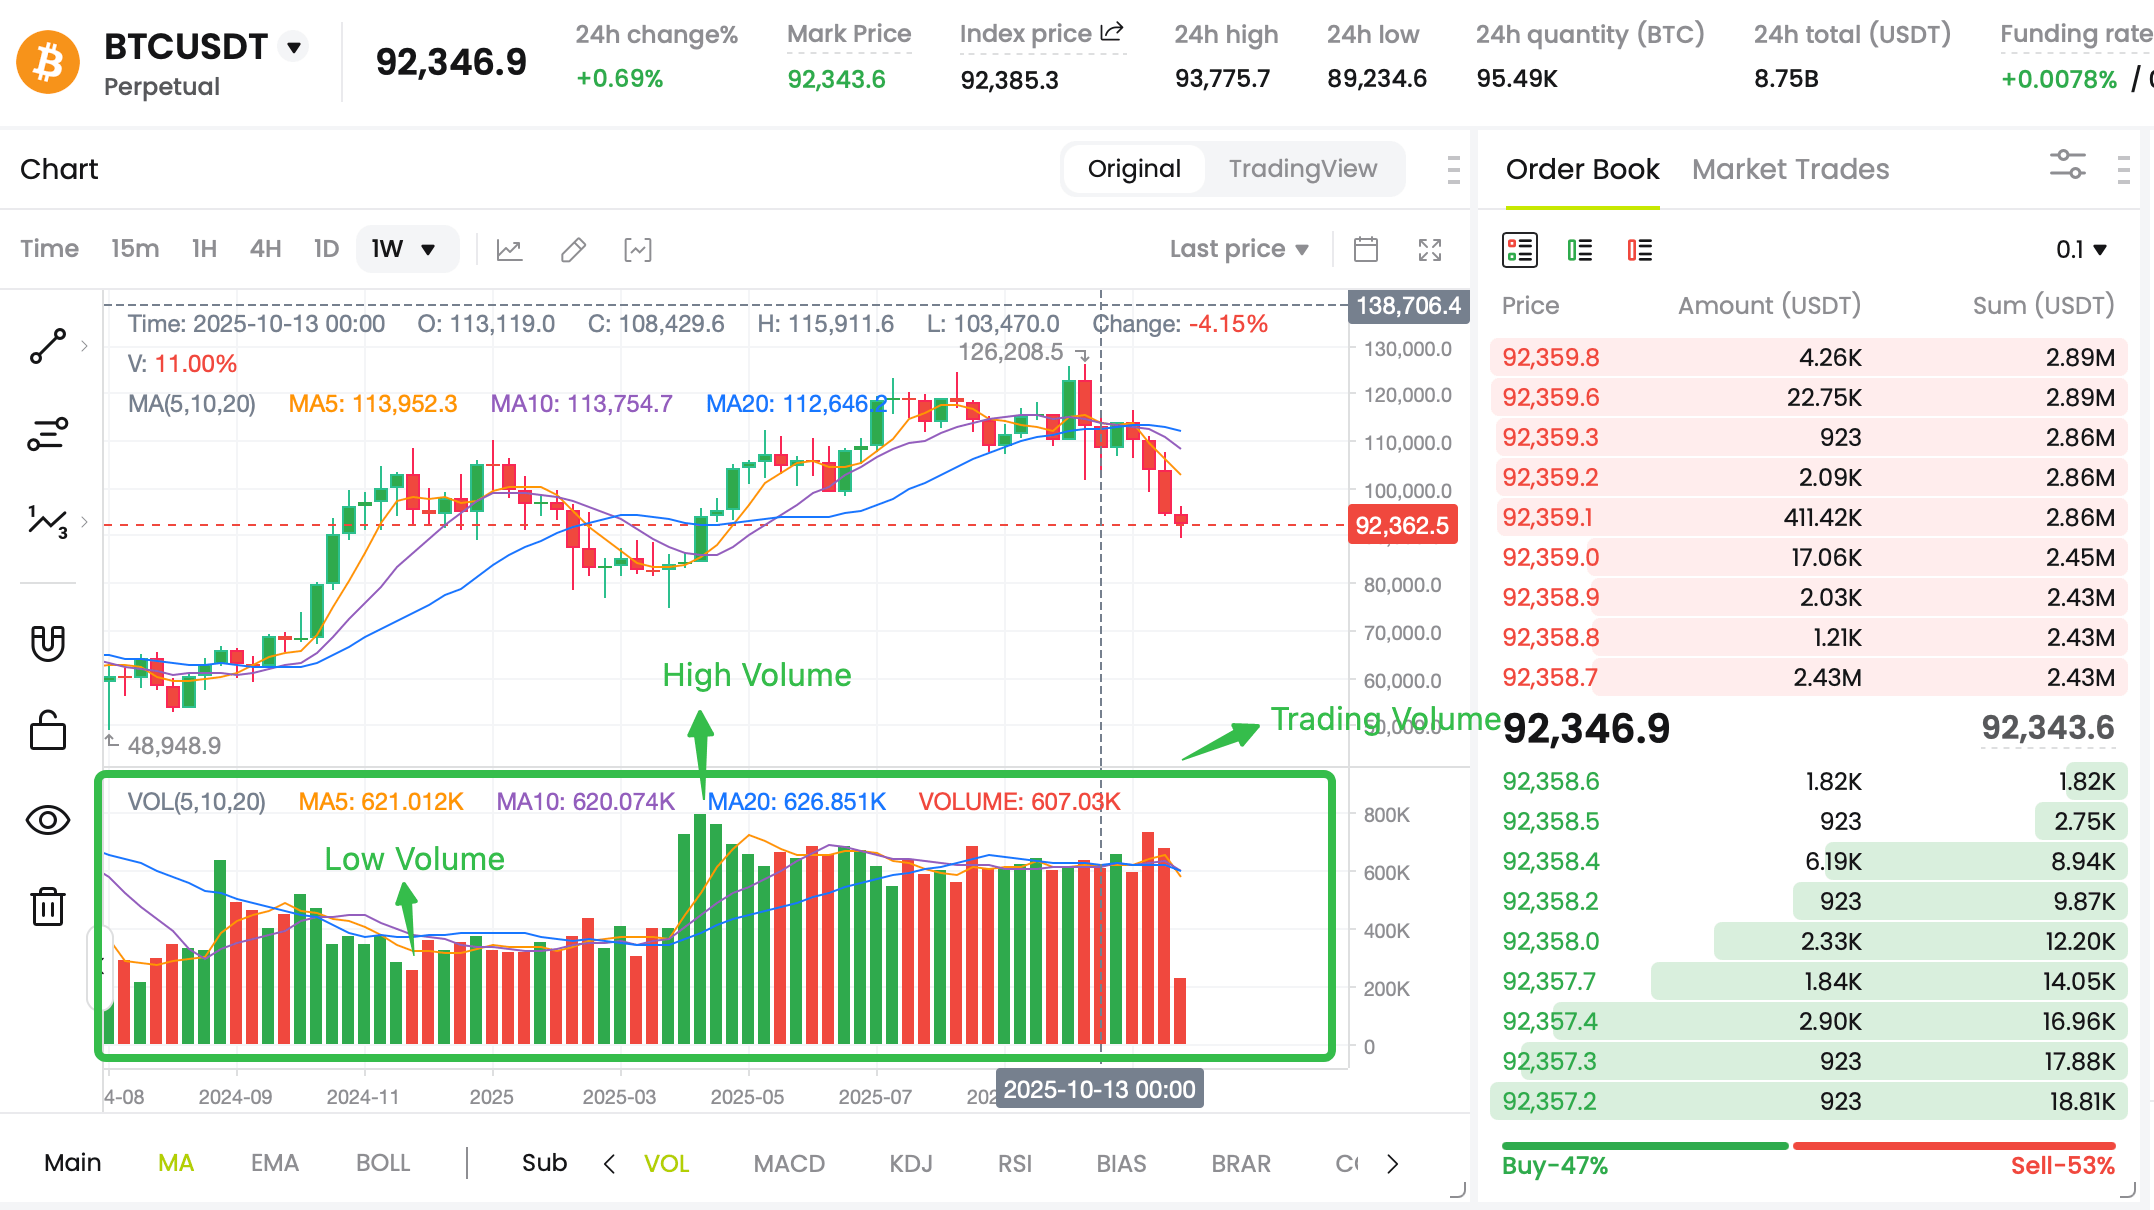
Volume (VOL): The total quantity of an asset traded during a specific period.
-
On-Balance Volume (OBV): OBV is a cumulative indicator that adds volume on up days and subtracts it on down days to show buying/selling pressure.
-
Money Flow Index (MFI): MFI is an oscillator that combines price and volume to identify overbought/oversold conditions on a 0-100 scale.
-
Chaikin Money Flow (CMF): CMF measures money flow volume over a period by comparing closing prices to high-low ranges to indicate buying or selling pressure.
-
Volume Price Trend (VPT): VPT combines volume with price changes to show whether a trend is supported by volume.
-
Accumulation/Distribution Line (A/D): A/D shows whether an asset is being accumulated or distributed by comparing the close price position with trading range and volume.
Combining Volume with Other Indicators
While volume indicators provide valuable standalone insights, their power is magnified when combined with other technical analysis tools. Some effective combinations include:
-
Volume + RSI: When volume rises alongside high RSI readings, it may indicate a strong trend (either upward or downward).
-
Volume + MACD: When MACD lines cross with increasing volume, it often signals a stronger price movement.
-
Volume + Bollinger Bands: Breakouts accompanied by high volume are more likely to be sustained, while those with low volume often fail.
Interpreting Volume Signals
Effectively interpreting volume signals is both an art and a science, requiring contextual understanding and pattern recognition. While specific numerical values vary between assets, relational patterns provide consistent signals across different cryptocurrencies.
Volume-Price Relationships
The relationship between volume and price movements offers crucial insights into market dynamics. Several key patterns consistently appear across cryptocurrency markets:
-
Upward Price Movement with Increasing Volume: This classic pattern signals healthy buying interest and suggests the uptrend is likely to continue. The rising volume confirms that new buyers are entering the market, providing fuel for further price appreciation.
-
Downward Price Movement with Increasing Volume: Falling prices accompanied by rising volume indicate strong selling pressure and often foreshadow further declines. This pattern frequently occurs during market capitulation phases when fear dominates trader psychology.
-
Price Advances on Diminishing Volume: When prices rise while volume decreases, it suggests limited buying interest and potential exhaustion of the trend. This divergence often precedes a trend reversal or consolidation period.
-
Price Declines on Diminishing Volume: Falling prices with declining volume may indicate that selling pressure is waning, potentially signaling an upcoming reversal or bounce.
Breakouts and Breakdowns
Volume analysis is particularly valuable for assessing the validity of price breakouts. When an asset breaks through key resistance or support levels with significantly higher volume, it suggests strong conviction and increases the probability of a sustained move. Conversely, breakouts at low volume are suspect and prone to failure, as they lack broad market participation.
Cryptocurrency traders closely watch volume during breakout attempts from consolidation patterns. A genuine breakout typically exhibits volume well above the recent average, while false breakouts often show muted volume activity.
Divergence Analysis
Divergences between volume indicators and price action often provide early warning signals of potential trend changes. For example, when prices make a new high, while an indicator like OBV fails to confirm that high, it suggests weakening momentum and possible reversal. These divergences can occur in both bullish and bearish contexts:
In cryptocurrency markets, where sentiment can shift rapidly, these divergences can help traders anticipate reversals before they become apparent in price action alone.
Volume Climax and Exhaustion
Extremely high volume levels often signal climax points that can mark trend endings. Volume spikes frequently occur at market tops (as capitulation buying peaks) and at market bottoms (as panic selling exhausts itself). These volume climaxes represent emotional extremes and often coincide with important trend changes.
Limitations and Considerations of Volume Analysis in Trading
While volume analysis provides valuable insights, it's crucial to understand its limitations and potential pitfalls, especially in cryptocurrency markets. Blindly following volume signals without considering context can lead to poor trading decisions.
Market Manipulation Concerns
Cryptocurrency markets, particularly smaller-cap assets, are susceptible to manipulation that can distort volume signals. "Wash trading" (simultaneously buying and selling to create artificial activity) remains a problem on some exchanges, inflating reported volumes and creating false signals. Large players can also engineer volume spikes to trigger stop losses or lure retail traders into positions.
One trader's skeptical perspective highlights this concern: "High volume might just be major holders dumping positions! Those so-called 'volume increase means higher demand' statements sound nice, but have you considered that this high volume could be whales distributing?". This underscores the importance of considering volume data in context rather than at face value.
Inconsistent Data Quality
Unlike traditional markets with centralized reporting, cryptocurrency volume data is fragmented across numerous exchanges with varying reporting standards. Some platforms may exaggerate volumes to appear more liquid, while others might use different methodologies for calculation. This inconsistency requires traders to be selective about their data sources and consider cross-referencing volume information across multiple reputable exchanges.
False Signals and Context Dependence
Volume indicators, like all technical analysis tools, produce false signals. A trader's experience illustrates this point: "I've seen plenty of cases with high volume and high RSI that ended with a sharp drop an hour later". These false signals can result from unusual market conditions, unexpected news events, or structural market changes.
Volume analysis must always consider the broader market context. For instance, high volume during a price decline might normally suggest further downside, but if it occurs at a major historical support level, it could represent a selling climax and potential reversal point.
Not a Standalone Solution
Perhaps the most important limitation to recognize is that volume analysis should not be used in isolation. As one experienced trader notes, "VOL is indeed useful, but it's just one of many tools. I recommend using volume as supplementary confirmation rather than as a primary basis". Successful trading requires combining volume analysis with other forms of technical and fundamental analysis, risk management principles, and market awareness.
Timeframe Considerations
Volume signals can vary significantly across different timeframes. A volume spike on a 5-minute chart might indicate short-term sentiment shifts, while the same spike on a daily chart could signal a major trend change. Traders must align their volume analysis with their trading timeframe and avoid extrapolating signals across different time horizons.
Conclusion
Volume indicators represent indispensable tools in the cryptocurrency trader's arsenal, providing unique insights into market dynamics that price action alone cannot reveal. From confirming trends and detecting reversals to identifying institutional activity and market manipulation, volume analysis enhances trading decisions across various strategies and timeframes.
The most effective approach combines volume indicators with other technical analysis tools, fundamental factors, and robust risk management. As one trader aptly notes, "VOL is indeed useful, but it's just one of many tools". This balanced perspective prevents overreliance on any single indicator while leveraging the distinct advantages that volume analysis offers.
As cryptocurrency markets continue evolving with increasing institutional participation and regulatory clarity, volume analysis will likely become even more sophisticated. New indicators will emerge, and existing ones will be refined better to capture the unique characteristics of digital asset markets. However, the core principles of volume analysis, that volume validates price action and reveals market conviction, will remain fundamental to understanding market dynamics.
For traders seeking to navigate the volatile cryptocurrency landscape, developing proficiency in volume analysis is not optional, it's essential. By understanding both the power and limitations of volume indicators, traders can make more informed decisions, better manage risk, and potentially improve their trading performance in these exciting butchallenging markets.
References:
CoinCatch Team
Disclaimer:
Digital asset prices carry high market risk and price volatility. You should carefully consider your investment experience, financial situation, investment objectives, and risk tolerance. CoinCatch is not responsible for any losses that may occur. This article should not be considered financial advice.