In cryptocurrency trading, identifying continuation patterns like bull and bear flags can be the difference between catching a breakout early or missing out entirely. These flag patterns help traders identify brief pauses in a strong trend before continuing in the same direction. As crypto markets in 2025 witness dramatic swings—from Bitcoin's 13% rebound to $114,800 after a $193 billion liquidation crash to Ethereum's resilience ahead of its Fusaka upgrade, these patterns offer traders a framework to capitalize on momentum. This article explores the structure, trading strategies, and real-world applications of flag patterns, emphasizing their relevance in today's crypto landscape.
Understanding Flag Patterns
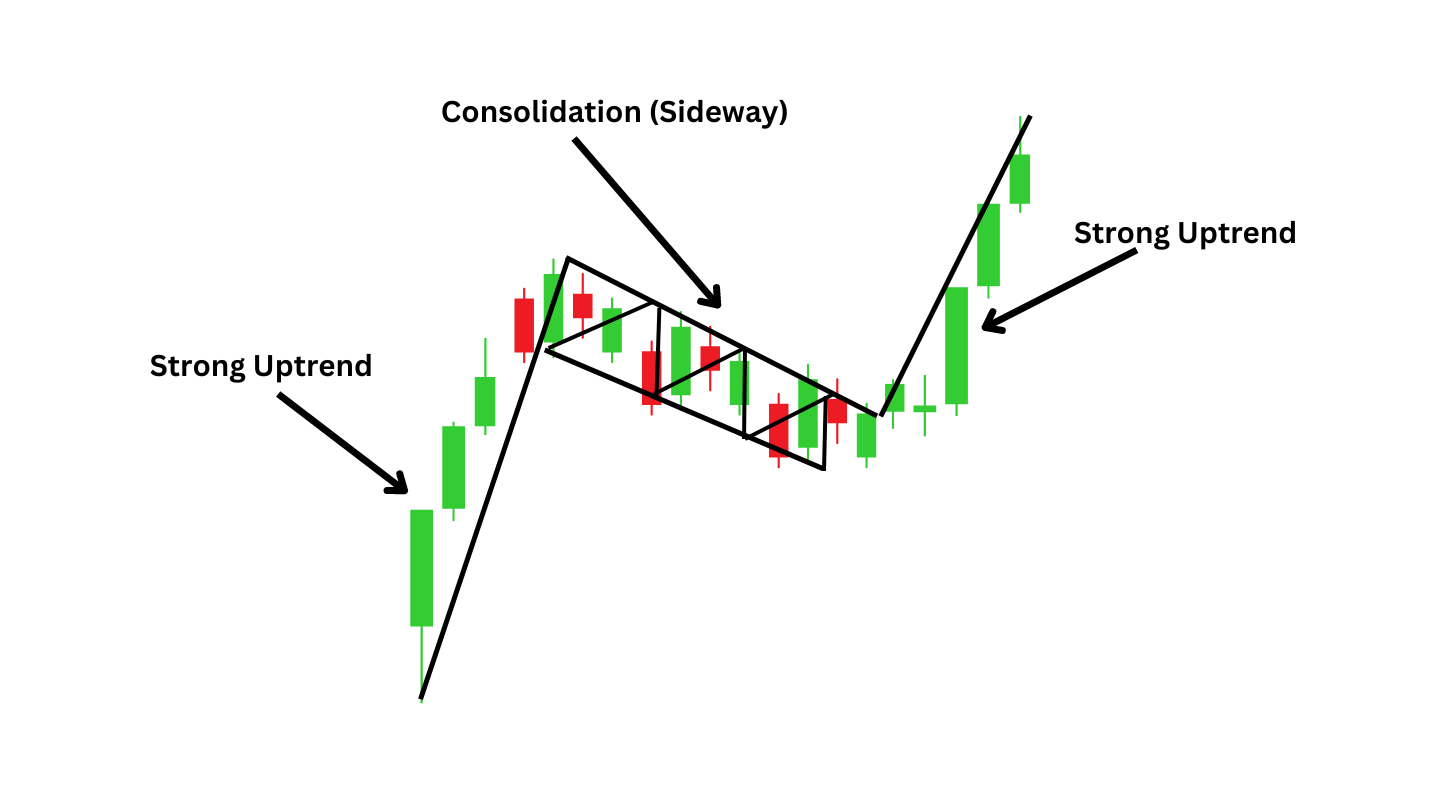
Flag patterns are short-term consolidation phases that occur after a sharp price movement, known as the
flagpole. The pattern resembles a flag on a pole, consisting of two components:
Flagpole: A steep, nearly vertical price surge (bullish) or decline (bearish) driven by high trading volume.
Flag: A parallel or slightly sloping channel representing temporary consolidation before the trend resumes.
These patterns are classified as
continuation patterns, meaning they indicate a brief pause in the market before the prior trend reasserts itself. For instance, a bull flag forms during an uptrend when prices consolidate downward or sideways, while a bear flag appears in a downtrend with a slight upward or horizontal correction. Their reliability stems from collective market psychology—initial volatility exhausts momentum, leading to a period of equilibrium before breakout traders reignite the trend.
Bull Flag Patterns: Riding the Upward Momentum
A bull flag is a chart pattern used by technical traders to signal when the market is likely to rally further. This pattern usually appears when prices undergo a short-term corrective phase within a broader uptrend, indicating that the asset is likely to experience a further rise in price. The pattern unfolds in specific phases, starting with a significant upward surge caused by a strong influx of buying pressure. This initial movement can be a reaction to positive sentiment, fundamental news, or market dynamics that favour an increase in the asset’s value.
How to Spot a Bullish Flag 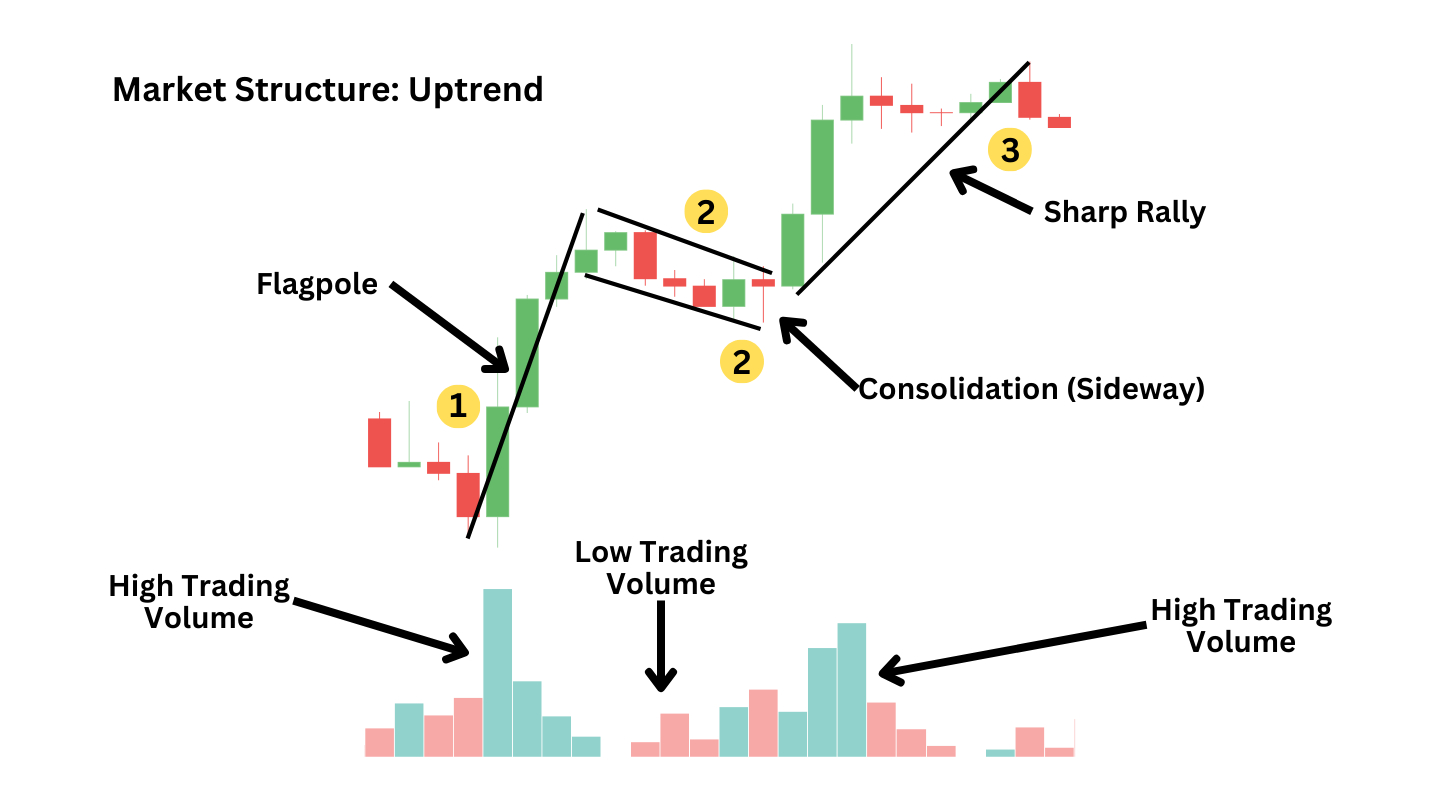
The bullish flag pattern undergoes three distinct phases of development. As a trader, you’ll try to pick up on the bullish flag at the second phase and trade it through the third phase. Here’s how you can spot each of these phases.
Phase One – The Flagpole: The appearance of a bullish flag starts with an evident display of upward momentum, characterised by a substantial rise in prices. This rally is marked by a notable increase in volume, with the price reflecting strong buying pressure.
Phase Two – The Flag: Prices consolidate and move slightly downward within a narrow price range after an initial surge. This phase resembles the shape of a flag marked by a series of lower highs and lower lows, creating a channel that slopes downwards as the volume decreases.
Phase Three – The Breakout: The pattern completes with a break above the upper boundary of the consolidation range, indicating a continuation of the initial uptrend. This breakout point is critical, as it validates the bullish flag pattern and signals the continuation of upward momentum, ideally on increased volume.
Trading Strategy for Bull Flags
-
Entry: Enter a long position when the price breaks
above the flag's upper trendline, confirmed by rising volume.
-
Price Target: Calculate the flagpole's height (e.g., the rally from $100,000 to $115,000 = $15,000) and project it from the breakout point. If Bitcoin breaks at $112,000, the target would be ~$127,000.
-
Stop-Loss: Place a stop-loss order just below the flag's lower boundary to mitigate false breakouts.
In 2025, bull flags have shown a 67% accuracy rate in forex pairs like EUR/USD, with higher reliability on daily or weekly charts. Traders often combine volume analysis—where a decline during consolidation and a spike at breakout validates the pattern—with indicators like the Relative Strength Index (RSI) to avoid overbought conditions.
Bear Flag Patterns: Capitalizing on Downtrends 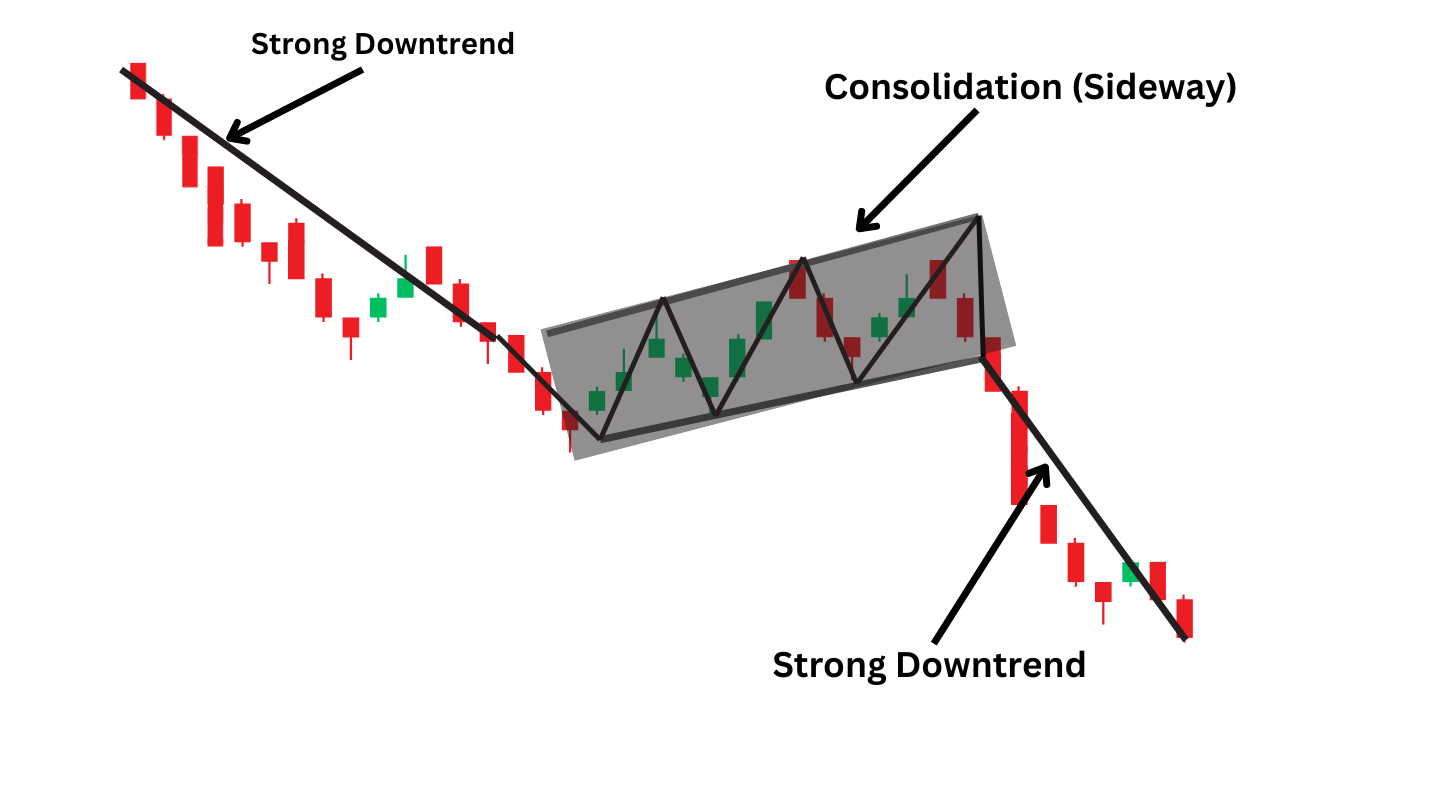
Bear flags form during sustained downtrends, characterized by a sharp decline (flagpole) followed by a weak upward retracement or sideways movement. The pattern anticipates further selling pressure. For instance, during the recent crypto liquidation crisis, assets like USDe stableton experienced bear flags before collapsing to $0.65 due to algorithmic failures and liquidity crunches.
It begins with a significant price drop due to the strong selling pressure. This steep fall demonstrates the overwhelming control of sellers over buyers where prices are being pushed lower quickly.
Following the sharp decline, prices undergo a cooling period without any major movements. They begin to consolidate and edge higher, representing a sense of indecision among traders. Traders may take profits following the rapid drop while others might wait for a potential reversal. However, this phase is generally short-lived, with the rally proving temporary as the trend returns to its downward trajectory.
A breakout below the lower boundary of the consolidation period marks the completion of this pattern. This is often confirmed by an increase in trading volume indicating that the downward trend is likely to continue.
How to Spot a Bearish Flag 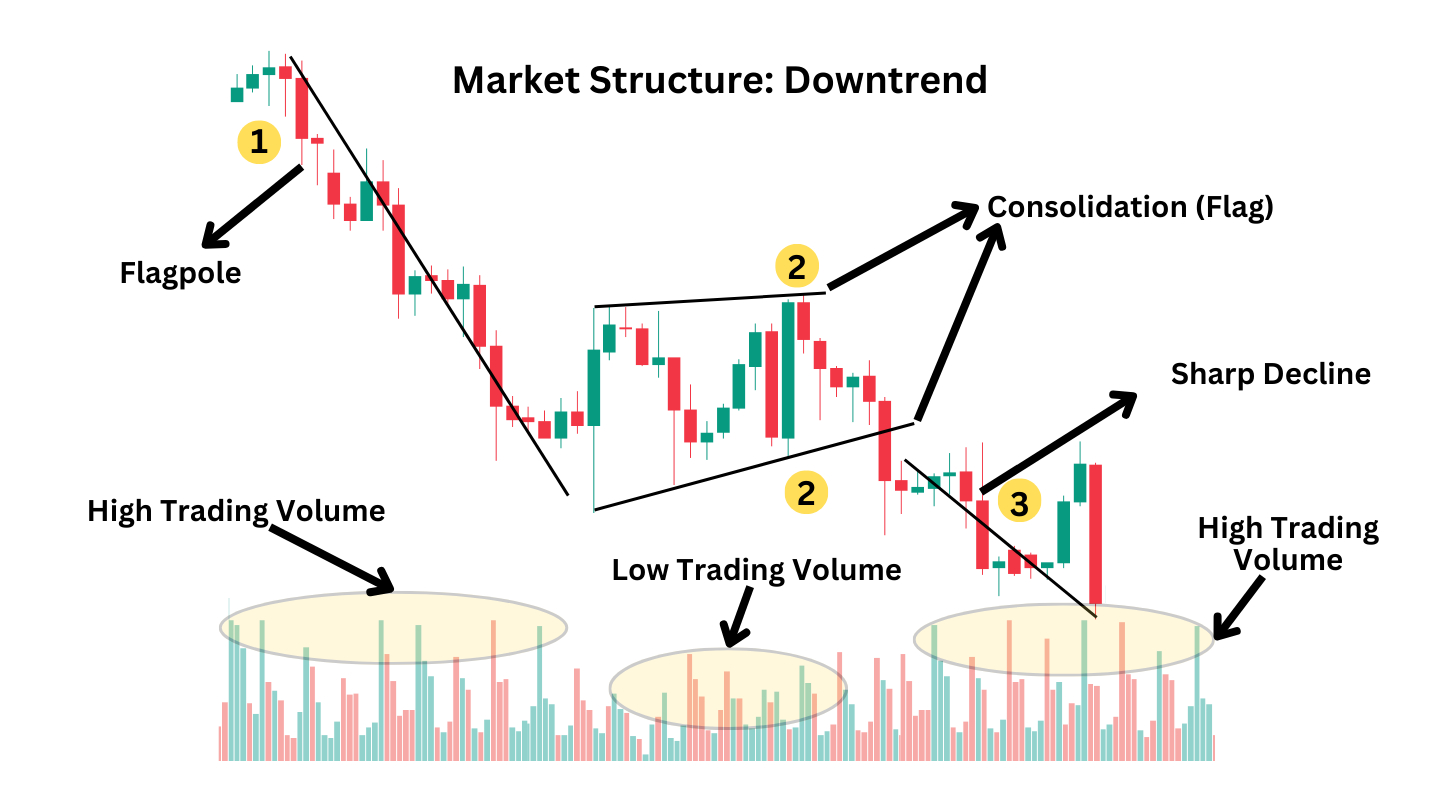
Recognizing a bear flag chart pattern involves understanding that its formation applies to all time frames and assets. Each phase of this pattern has distinct characteristics, which traders can identify on candlestick charts.
Phase One: This phase of the bear flag pattern is a clear display of a downtrend marked by a significant drop in prices. This sharp decline is identified as the ‘flagpole’, a visual representation of sellers taking control of the market. Trading volume generally spikes during this phase as a confirmation of the preceding downtrend.
Phase Two: Following the “flagpole”, the market enters a consolidation phase known as the “flag”. This is where prices start to reverse and move upwards in a channel-like shape within a relatively narrow range. Trading volume might start strong but generally decreases during flag formation, reflecting a temporary slowdown and indecision in the market.
Phase Three: The last phase of the pattern is the breakout. Prices drop below the lower boundary of the consolidation range, resuming the initial downtrend. This phase often sees an increase in trading volume, confirming the bearish trend resurgence with the sellers returning in the absence of buyers.
Trading Strategy for Bear Flags
-
Entry: Short-sell or exit positions when the price breaks
below the flag's lower trendline, accompanied by elevated volume.
-
Price Target: Subtract the flagpole's height from the breakout point. If Ethereum falls from $2,800 to $2,400 (flagpole = $400) and breaks at $2,500, the target is $2,100.
-
Stop-Loss: Set orders above the flag's upper trendline to limit risks from sudden reversals.
While bear flags in pairs like GBP/USD have a 63% historical accuracy, they require caution—false breakouts can occur during market noise, such as geopolitical events like Trump's tariff threats in 2025.
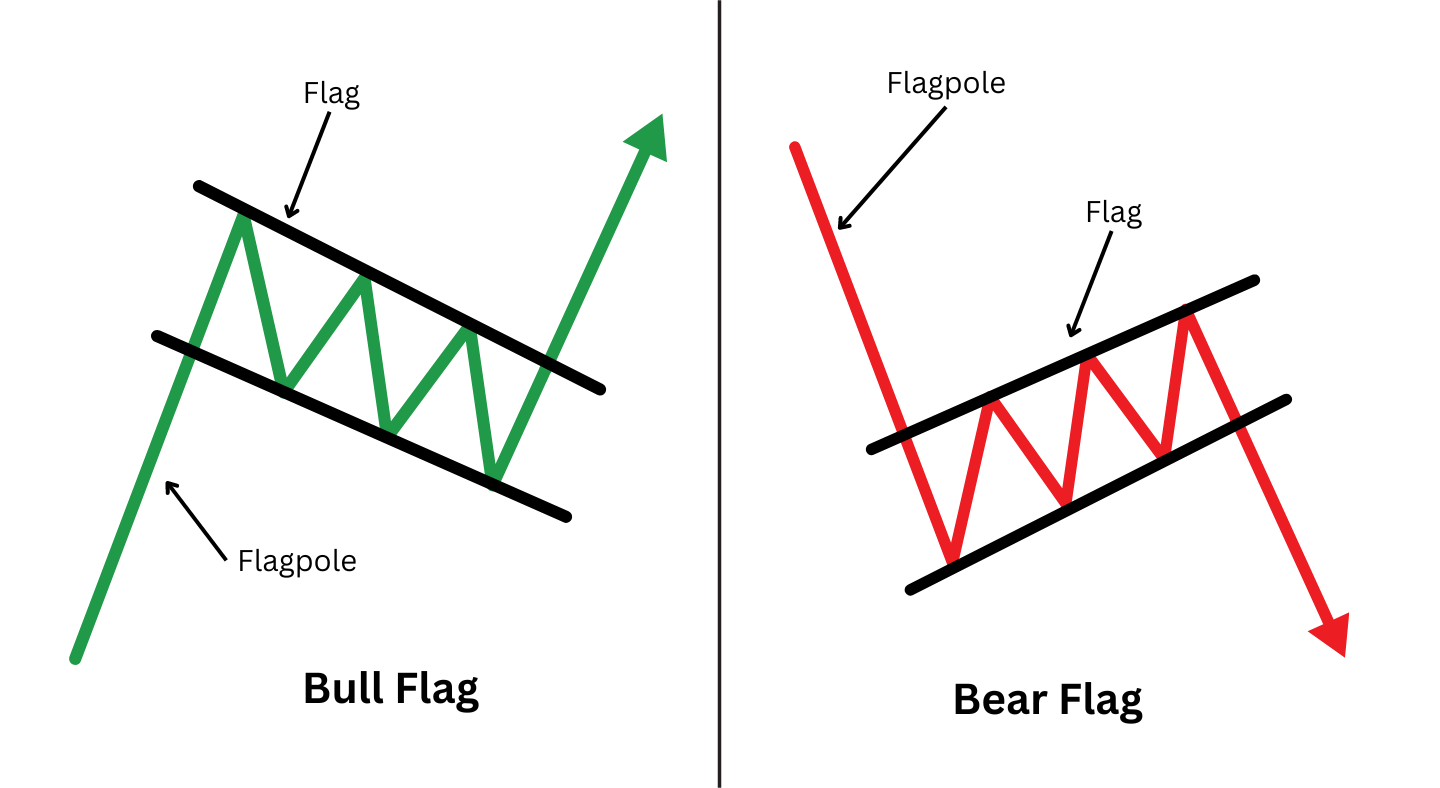
Bear Flag vs. Bull Flag
Understanding the distinction between bull and bear flag is important for traders analysing market trends. Both are continuation chart patterns that signal movements in opposite directions.
A bear flag pattern occurs during a downtrend. It begins with a strong downtrend known as the flagpole. This is trailed by a slight upward or horizontal consolidation, referred to as the flag. This consolidation typically slopes slightly upwards, resembling a small rising channel. During its formation, trading volume usually declines, then increases notably when the price pushes downwards from the flag. Traders would often enter a short trade when the price manages to break below anticipating the continuation of the downtrend.
Conversely, a bull flag pattern occurs during an upward trend. It starts with a significant upward price movement (flagpole), followed by a downward or horizontal consolidation known as the flag. This phase often slopes slightly downwards, mirroring a small descending channel. Like the bear flag, trading volume in bull flag pattern decreases during formation and increases as the price rally upwards. Price fluctuations above the flag is a cue for traders to take a long position, expecting the uptrend to continue.
Common Bear Flag Pattern Mistakes to Watch out
Deep Retracement Level: Traders engage in trades when the flag’s retracement level is too deep, such as at the 60% mark. This can significantly diminish the chart pattern’s reliability and increase the risk of unsuccessful trades.
Ignoring Volume Indicators: Many traders need to pay more attention to volume during the flag’s formation. Generally, the volume should decrease during the consolidation phase of the flag and then increase significantly when the price breaks downward. If you enter a trade without considering this volume confirmation, you may receive false signals.
Stop Loss levels: Setting the stop-loss just above the flag’s upper boundary is important to limit potential losses from an unexpected upward price reversal. Traders should avoid placing it too tight to prevent premature stop-outs.
Case Study: Flag Patterns in 2025 Crypto Rebound
The October 2025 market recovery exemplifies flag patterns in action. After a $193 billion liquidation crash, Bitcoin formed a bull flag as prices consolidated between $101,500 and $108,000. The breakout, fueled by institutional buying, propelled BTC to $114,800—a 13% surge. Similarly, Ethereum's ascent from $2,350 to $2,620 aligned with a bull flag, anticipating further gains from the Fusaka upgrade's efficiency improvements.
Conversely, bear flags warned of continued declines for altcoins like USDe, whose algorithmic stability mechanisms failed during volatility. This underscores the need for risk management—using stop-loss orders and position sizing (e.g., risking 1–2% per trade) to counter false signals.
Conclusion
Bull and bear flag patterns remain indispensable for navigating 2025's crypto volatility. Their structured approach—combining trend identification, volume analysis, and precise entry/exit points—empowers traders to leverage continuations in both bullish and bearish cycles. However, success hinges on integrating these patterns with macro-awareness and risk discipline. As markets evolve, flags offer a timeless lens to decode price action, turning chaos into opportunity.
References
CoinCatch Team
Disclaimer:
Digital asset prices carry high market risk and price volatility. You should carefully consider your investment experience, financial situation, investment objectives, and risk tolerance. CoinCatch is not responsible for any losses that may occur. This article should not be considered financi
al advice.