Candlestick charts are a widely used tool in financial analysis, employed by traders to examine price movements across various markets, including cryptocurrencies. Originally developed by Japanese traders in the 18th century, they have become a standard analytical instrument worldwide.
A candlestick chart visually displays price activity over a specified time interval. Each candlestick corresponds to a particular period, such as one hour or one day. The body of the candlestick indicates the opening and closing prices, while the wicks or shadows show the highest and lowest prices during that period. By interpreting candlestick patterns, traders can identify market trends, support and resistance levels, and potential reversal signals.
Proficiency in reading and analyzing candlestick charts is crucial for effective trading strategies. This article will provide an overview of candlestick charts, guidance on how to interpret them accurately, and common pitfalls to avoid.
What Are Candlestick Charts?
Candlesticks give you an instant snapshot of whether a market’s price movement was positive or negative, and to what degree.
-
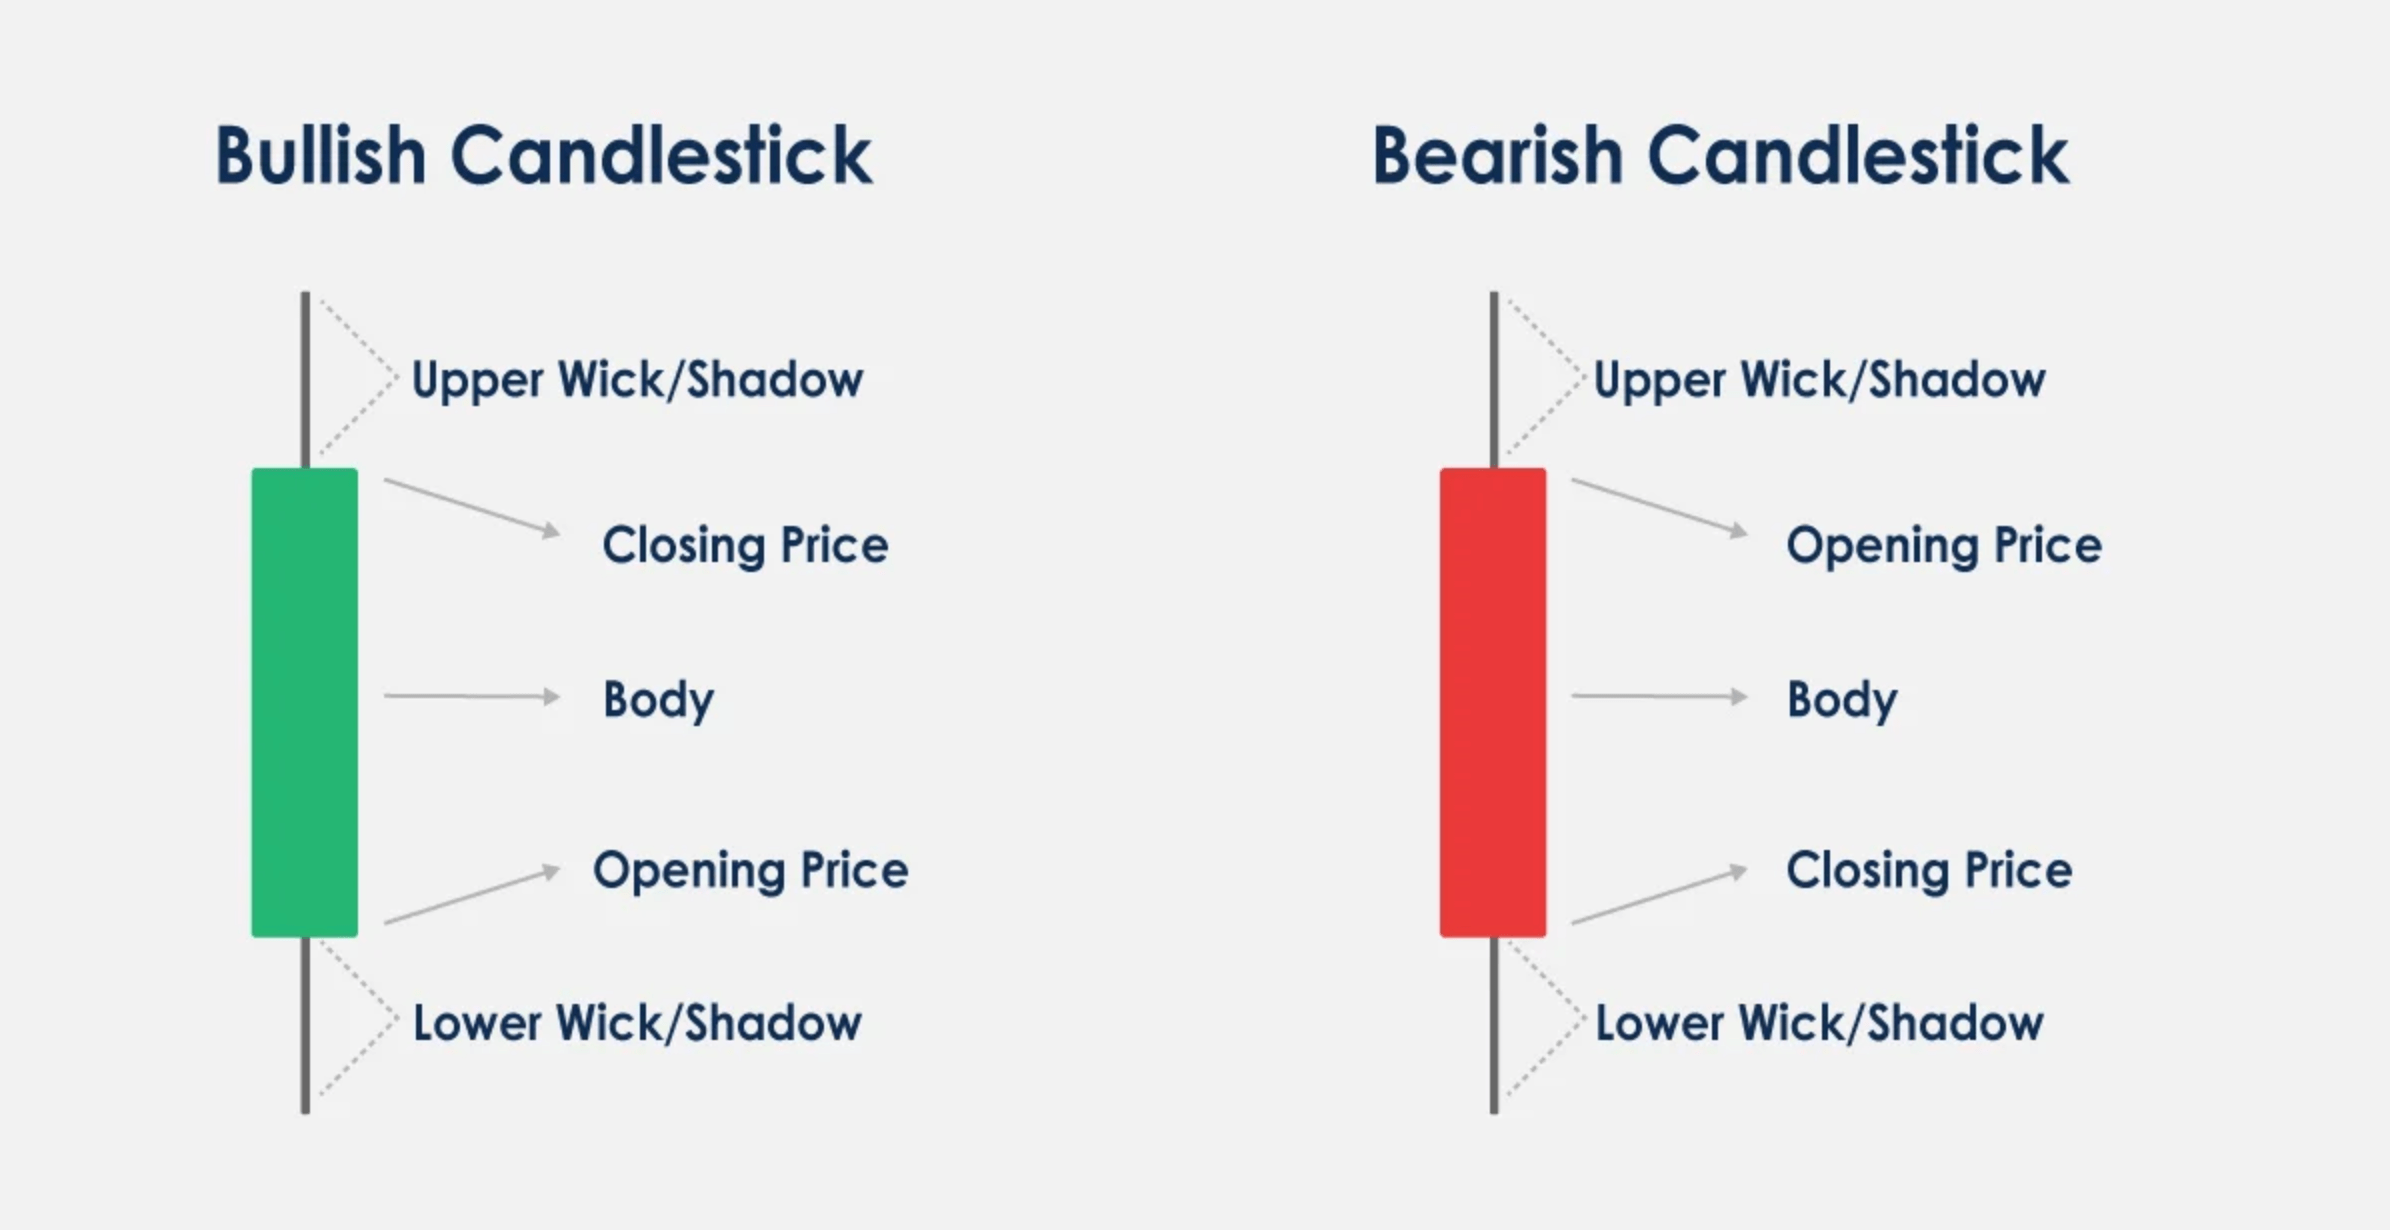
Green candles indicate prices going up, so the open is at the bottom
of the body and the close is at the top.
Red candles indicate prices declining, so the open is at the top of the body and close is at the bottom.
-
Each candle consists of the body and the wicks. The body of the candle tells you what the open and close prices were during the candle’s time frame.
-
The lines stretching from the top and bottom of the body are the wicks. These represent the highest and lowest
prices the asset hit during the trading frame.
Components of a Candlestick Chart
A candlestick chart comprises several key components that provide valuable information to traders.
The time frame
Candlestick charts represent price movements over a specific time frame, which can range from minutes to months. The time frame selected depends on your preference and the trading strategy being used.
The x-axis
The x-axis of a candlestick chart represents the time frame being analyzed. Each candlestick is a specific period, such as one hour, day, or week.
The y-axis
The y-axis of a candlestick chart represents the price range for the given time frame. The range is typically shown in dollars, euros, or any other currency depending on the trading pair being analyzed.
The body
The candlestick's body represents the opening and closing prices for the given time period. The color of the body indicates whether the period was bullish or bearish. A green or white body indicates a bullish trend, while a red or black body indicates a bearish trend.
The wicks
Wicks, also known as shadows or tails, represent the highest and lowest prices reached during the given time period. The length of the wick indicates the price range for the period.
Importance of Candlestick Charts in Crypto Trading
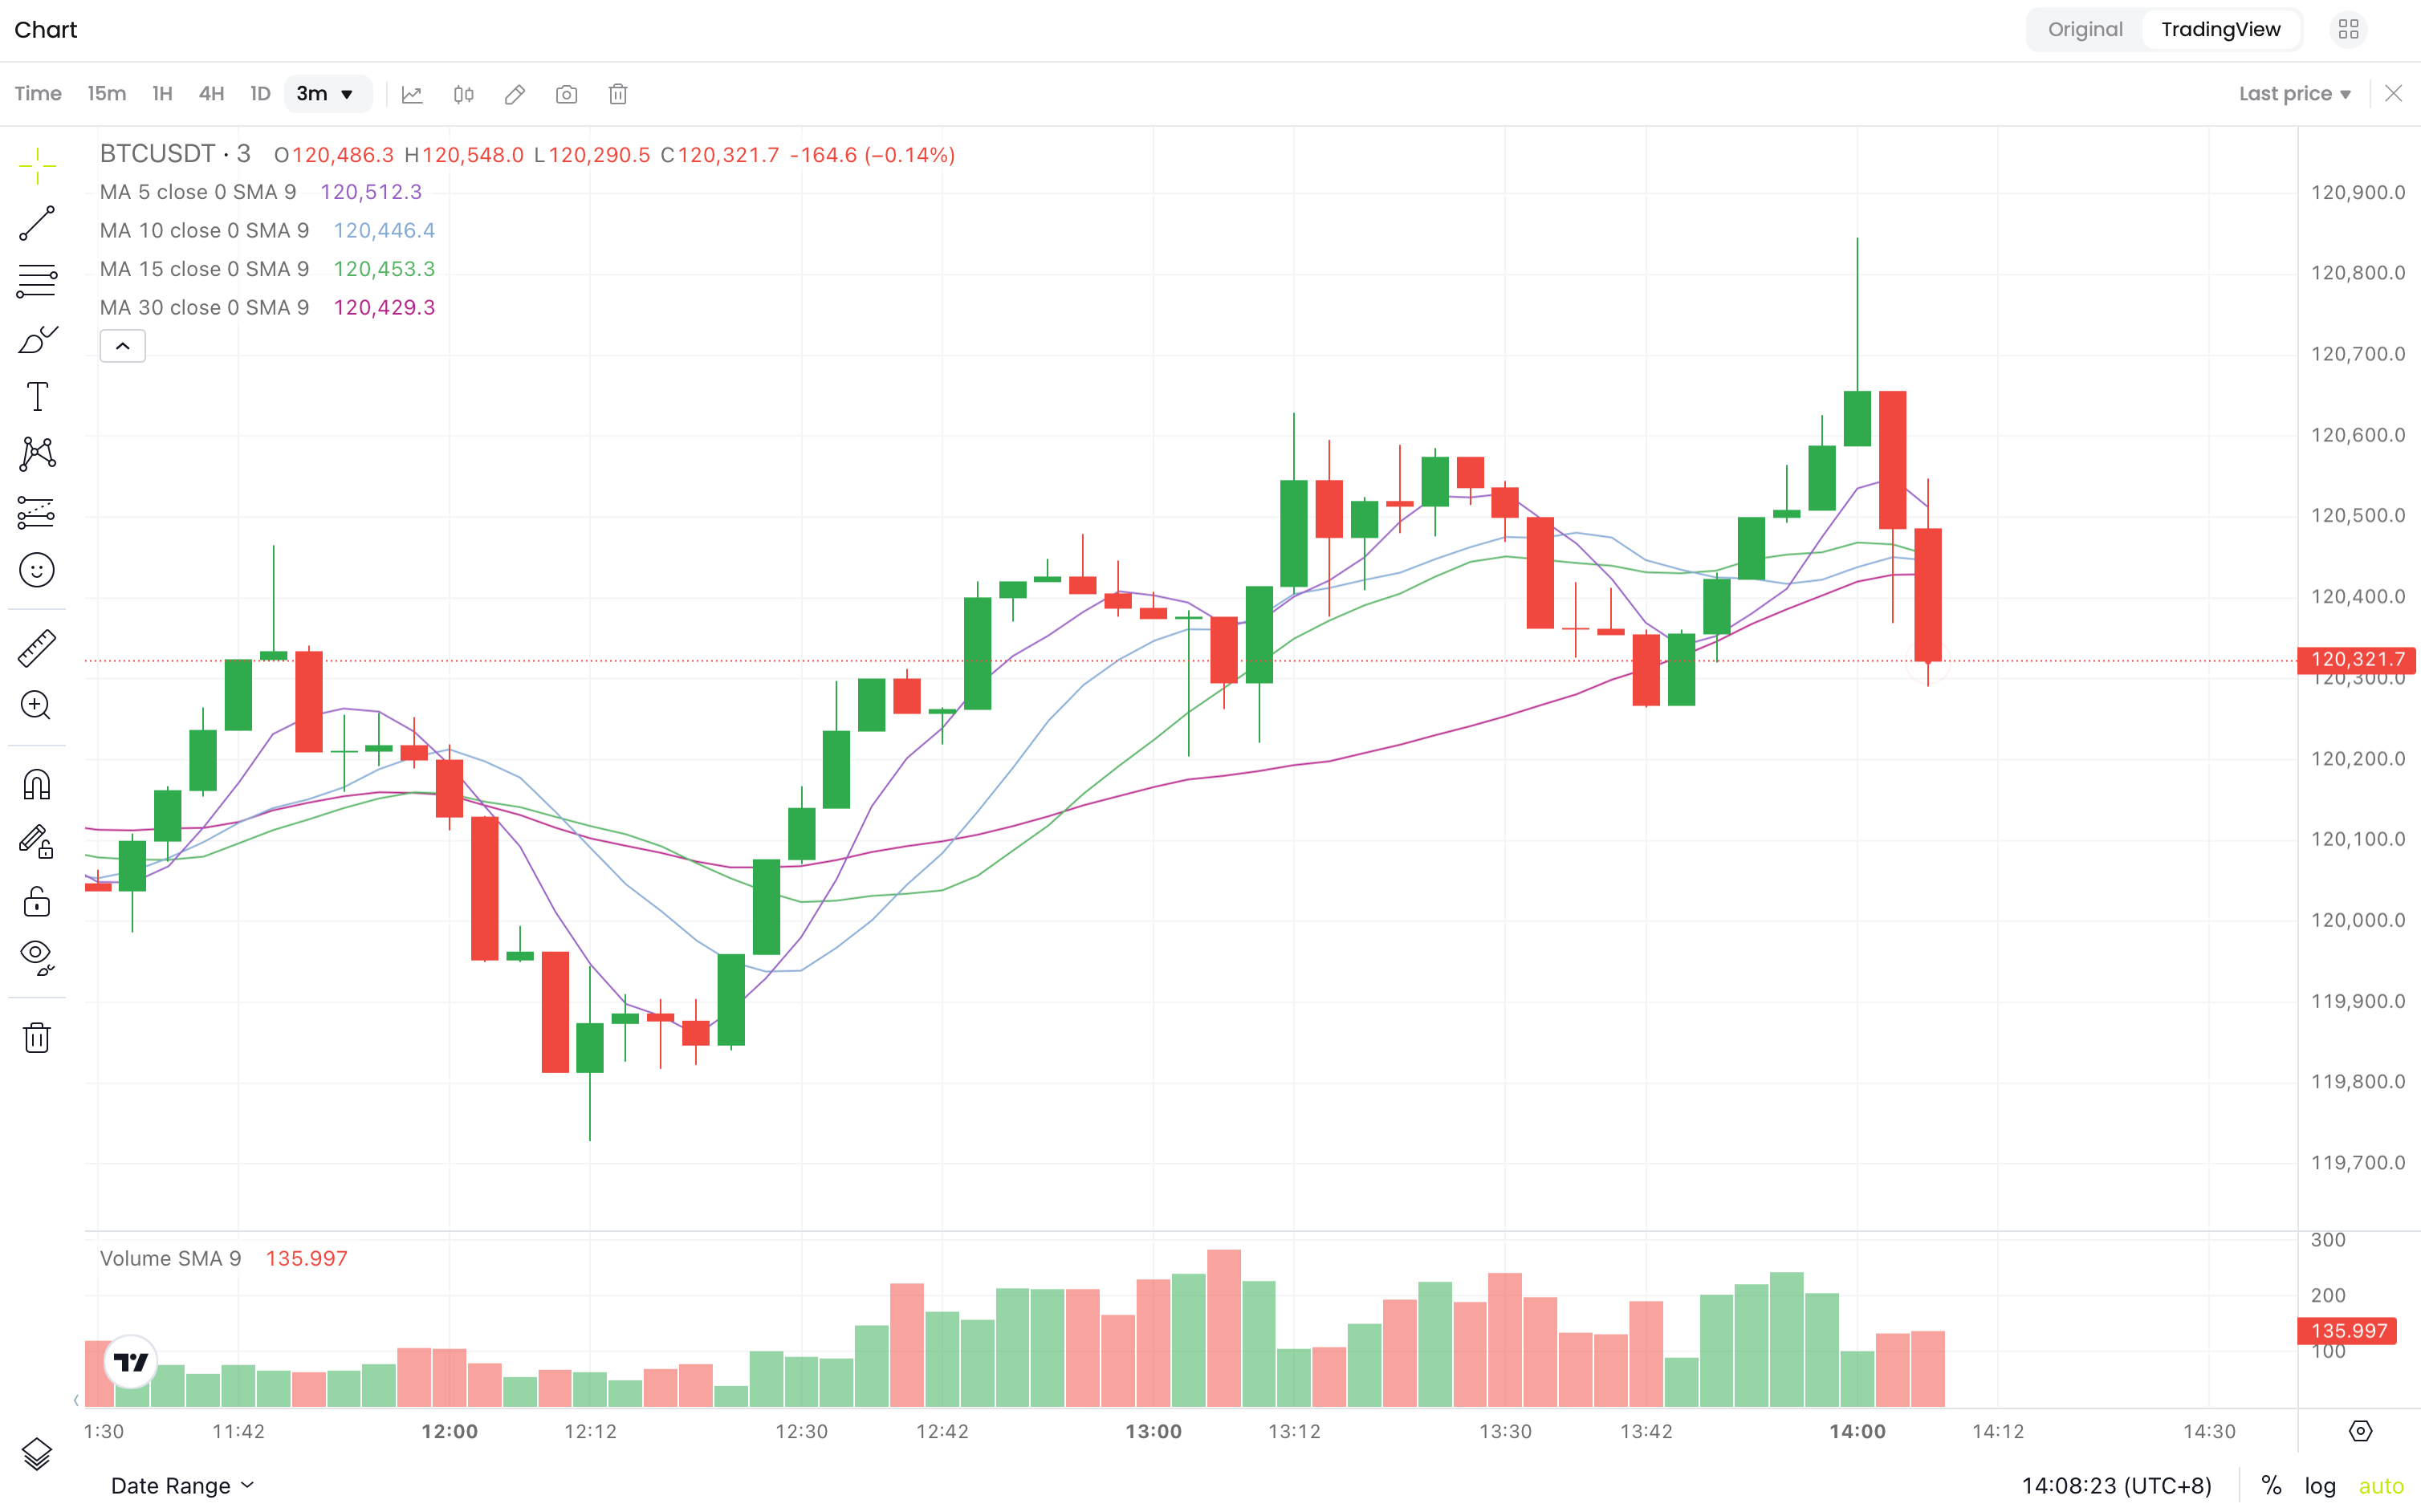
BTC Candlestick Charts Source: CoinCatch
Candlestick charts are indispensable in cryptocurrency trading due to their unparalleled ability to visually condense price action and market sentiment within specific timeframes, delivering significantly richer insights than basic line charts. Each candlestick simultaneously displays the open, close, high, and low prices, with its body (reflecting the open-close range) and wicks (showing price extremes) offering an immediate snapshot of bullish/bearish momentum: a green body indicates closing above opening (buyer dominance), while a red body signals seller control. Crucially, wick length exposes key rejection signals—long lower wicks (e.g., hammers) often appear at downtrend bottoms, suggesting buyer resurgence and potential reversals, whereas long upper wicks (like shooting stars) reveal strong resistance during rallies.
In the hyper-volatile, 24/7 crypto markets, candlestick pattern recognition becomes vital for spotting trend shifts. Strong-bodied candles (e.g., Marubozu with minimal wicks) emerging after consolidation frequently signal powerful trend initiations, while small-bodied candles with extended wicks (doji or spinning tops) indicate indecision and potential exhaustion—especially when occurring after sharp price moves. These patterns gain validity when corroborated by location (e.g., near support/resistance levels) and volume; a high-volume green candle breaking resistance confirms bullish continuation, whereas a long-upper-wick candle with fading volume at peaks hints at topping formation.
Furthermore, candlesticks serve as the foundational framework for integrating technical indicators: Oscillators like RSI or Stochastic can validate overbought/oversold conditions suggested by candles (e.g., a doji after a prolonged uptrend with RSI >70 strengthens reversal odds); Moving averages (e.g., EMA) help filter noise and establish trend direction; and Bollinger Bands interacting with wicks (e.g., price touching the upper band then forming a long upper wick) identify volatility breakpoints. Advanced tools like order flow footprint charts enhance traditional candles by overlaying volume-per-price data, exposing hidden supply/demand imbalances (e.g., positive delta showing aggressive buying) to deepen understanding of price movement drivers.
Ultimately, candlestick charts transcend mere price tracking: they decode market psychology, enabling crypto traders to time entries/exits strategically, manage risk, and synthesize multidimensional analysis into actionable decisions.
What is a Candlestick Pattern
A candlestick pattern is a strategy based on technical analysis that leverages historical price movements on charts to predict future price changes. Originating from techniques used by Japanese rice traders, these patterns have been trusted for decades to forecast market behaviour. They consist of one or more candlesticks, indicating whether the market will continue in the same direction, reverse, or remain stable.
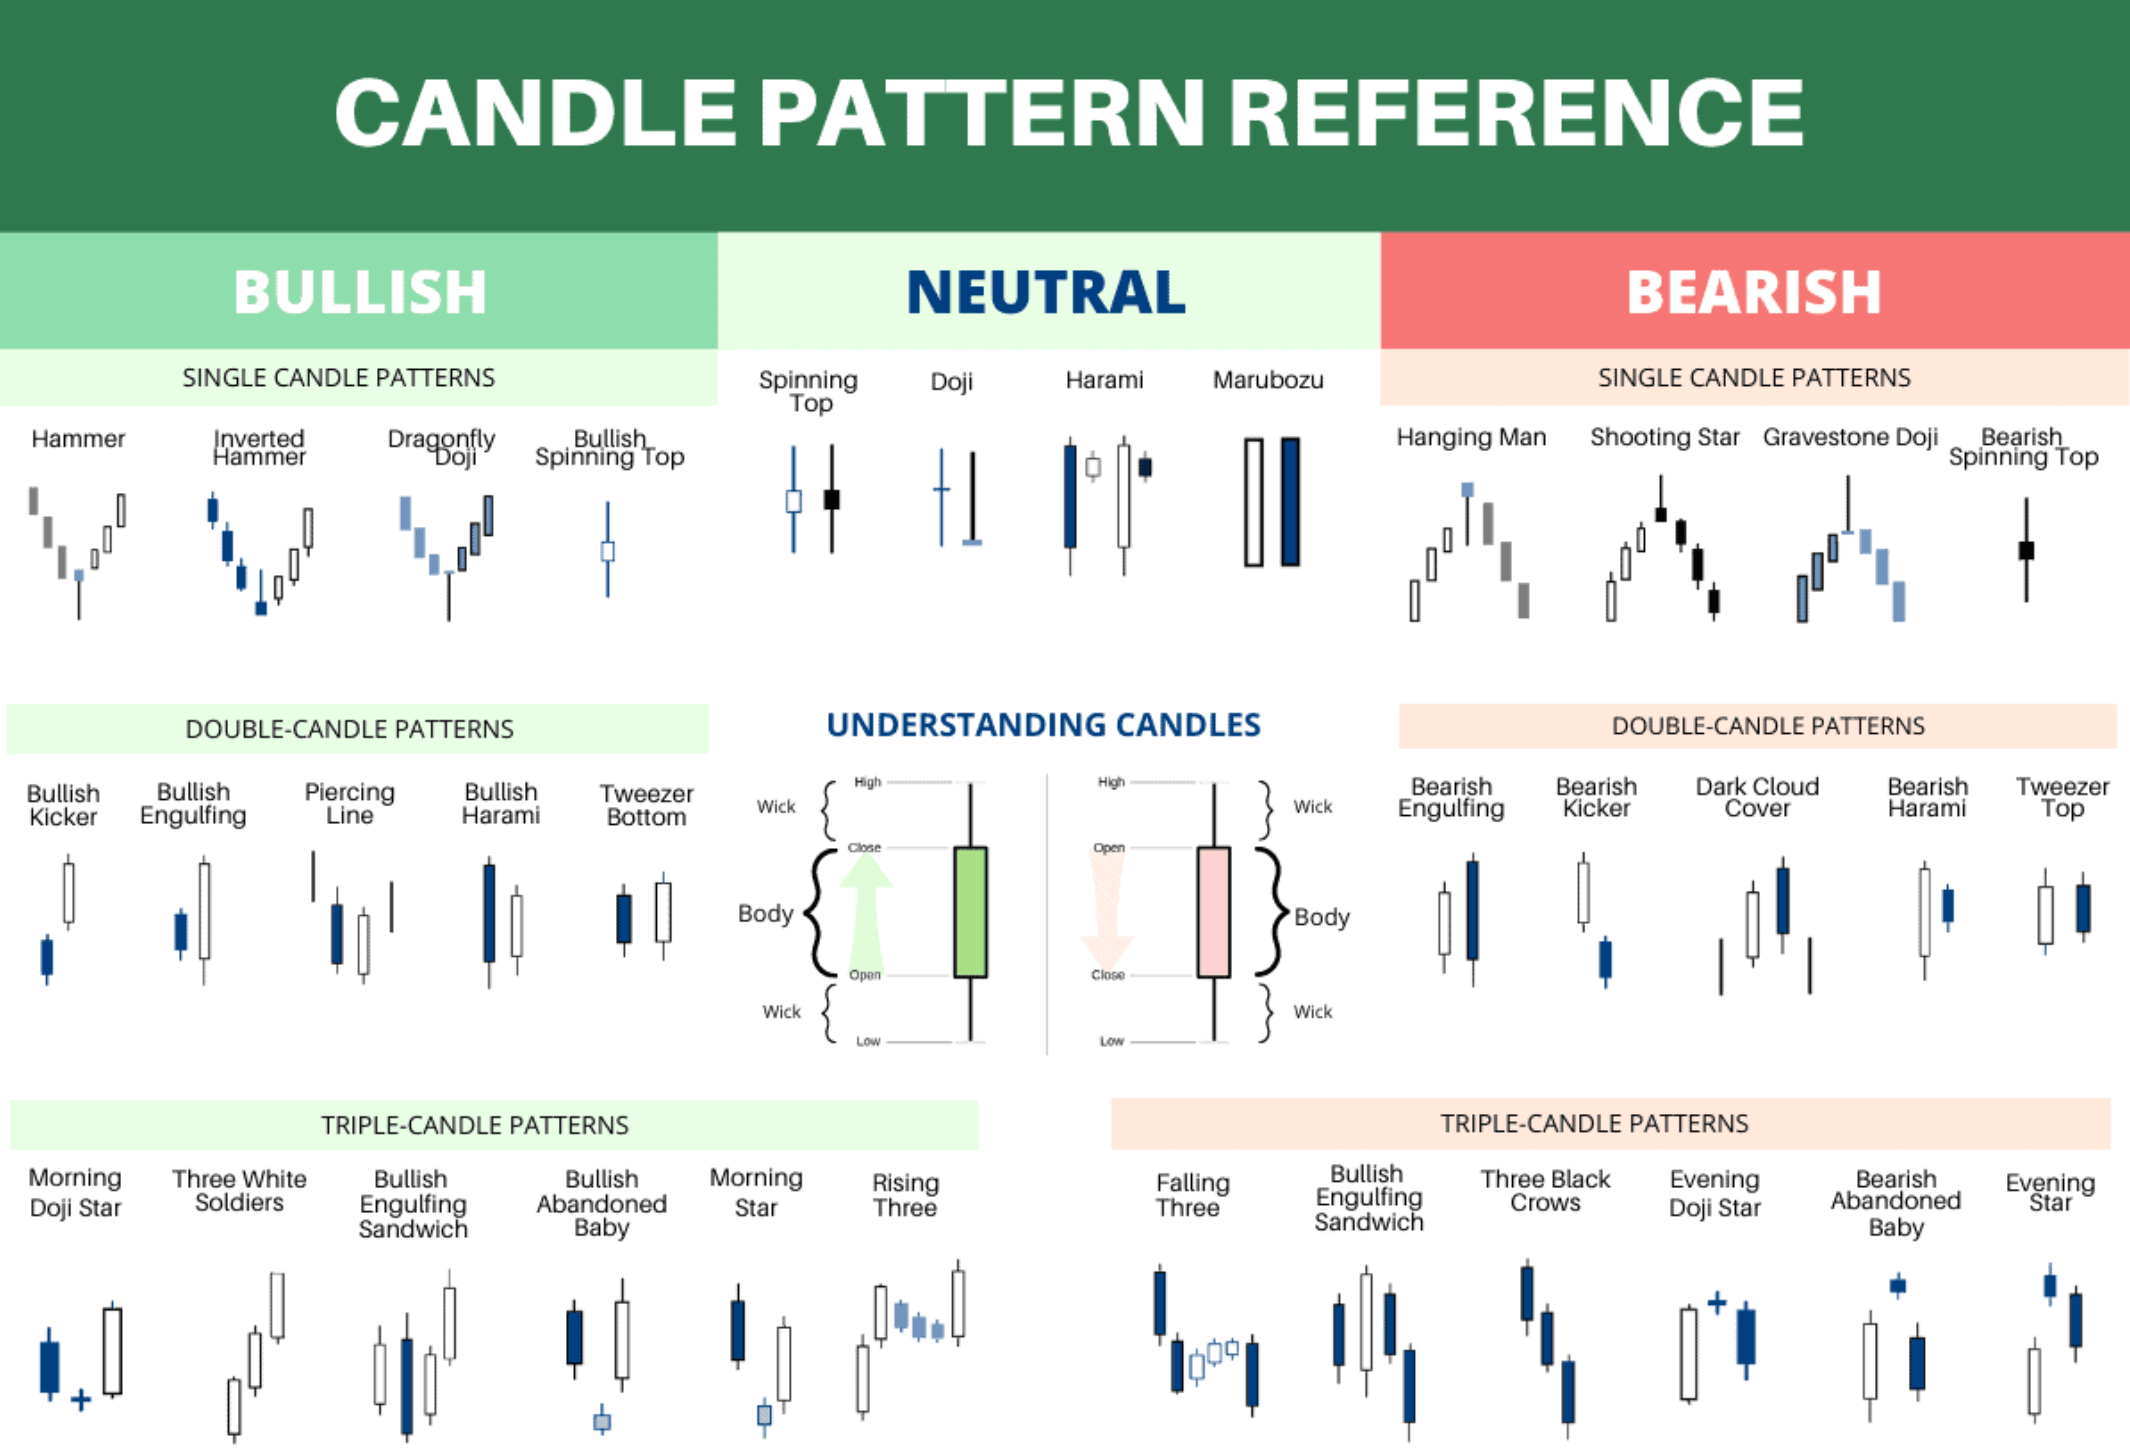
Common Candlestick Patterns
Candlestick patterns are important for you to identify potential crypto market trends and make informed trading decisions. Here are some common candlestick patterns you should be familiar with.
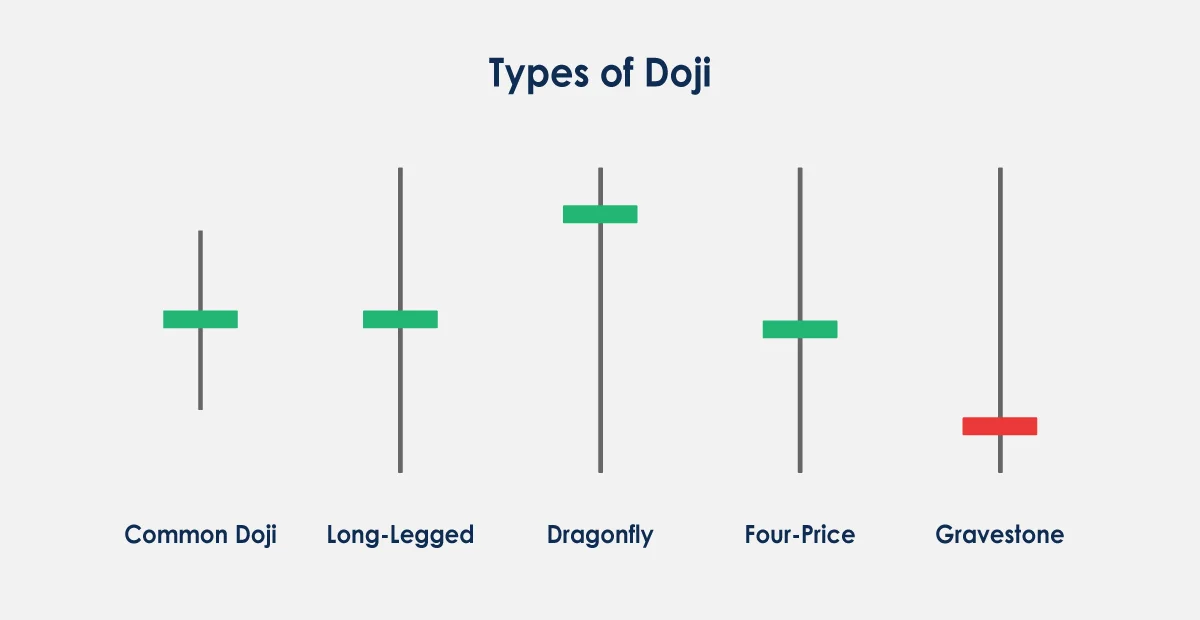
Doji
This is a candlestick with a small body and long wicks, indicating there's uncertainty within the market. A Doji pattern can signal a potential reversal or a continuation of the current trend.
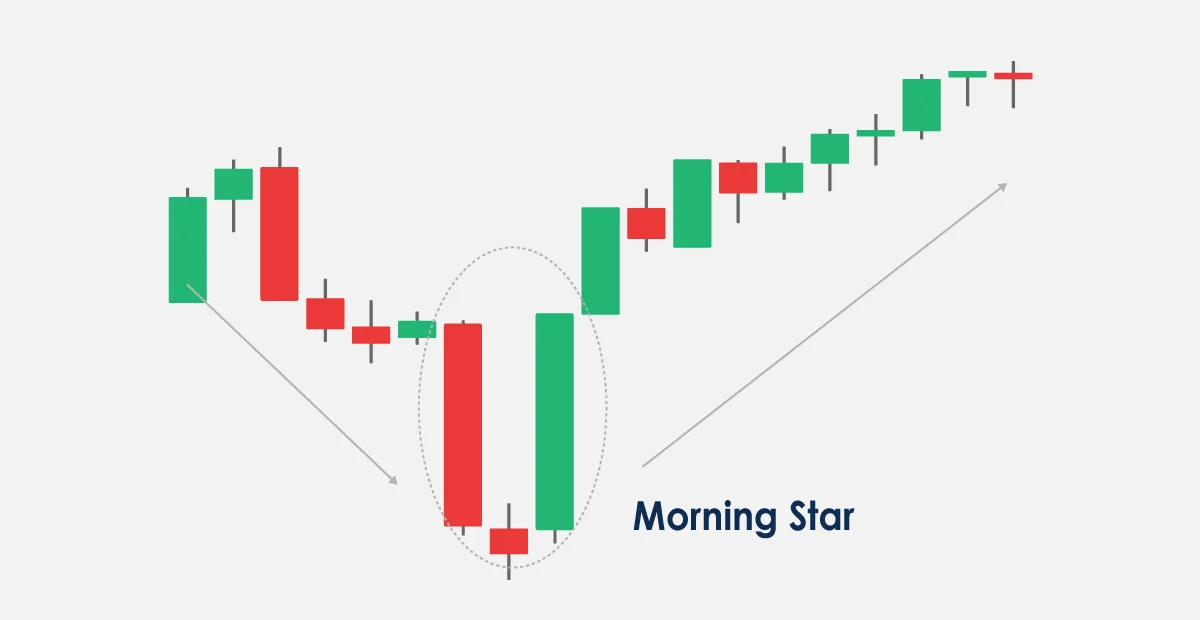
Morning Star
This bullish reversal pattern occurs after a downtrend. It consists of three candlesticks: a long bearish candle, a small candle with a short body and long wicks, and a long bullish candle.
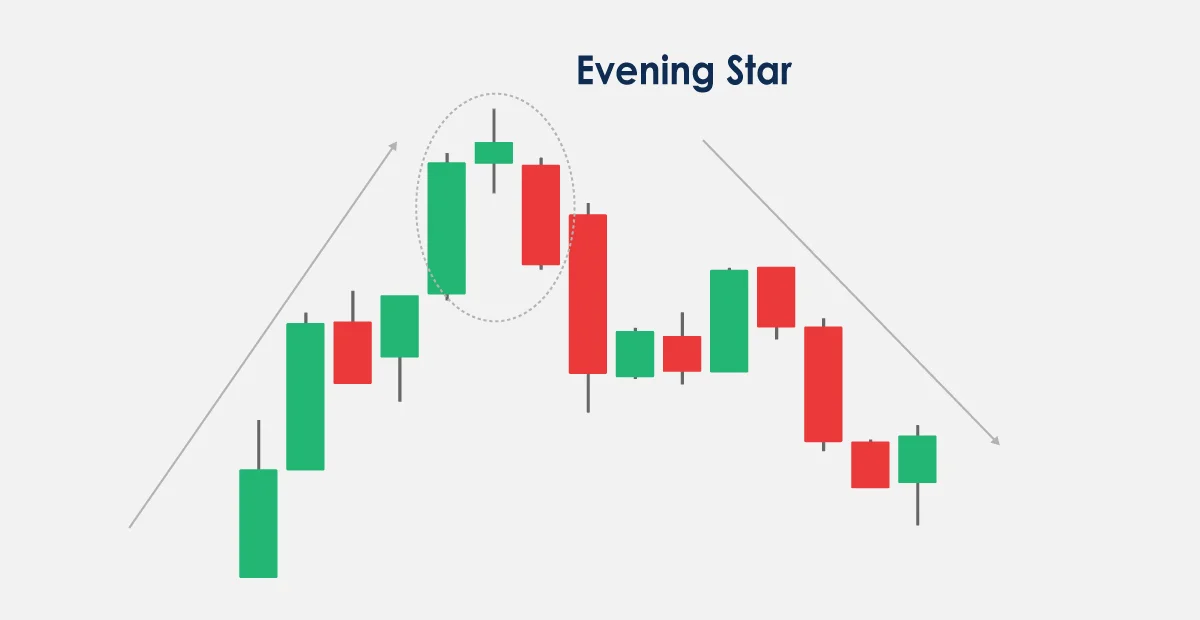
Evening Star
This bearish reversal pattern occurs after an uptrend. It consists of three candlesticks: a long bullish candle, a small candle with a short body and long wicks, and a long bearish candle.
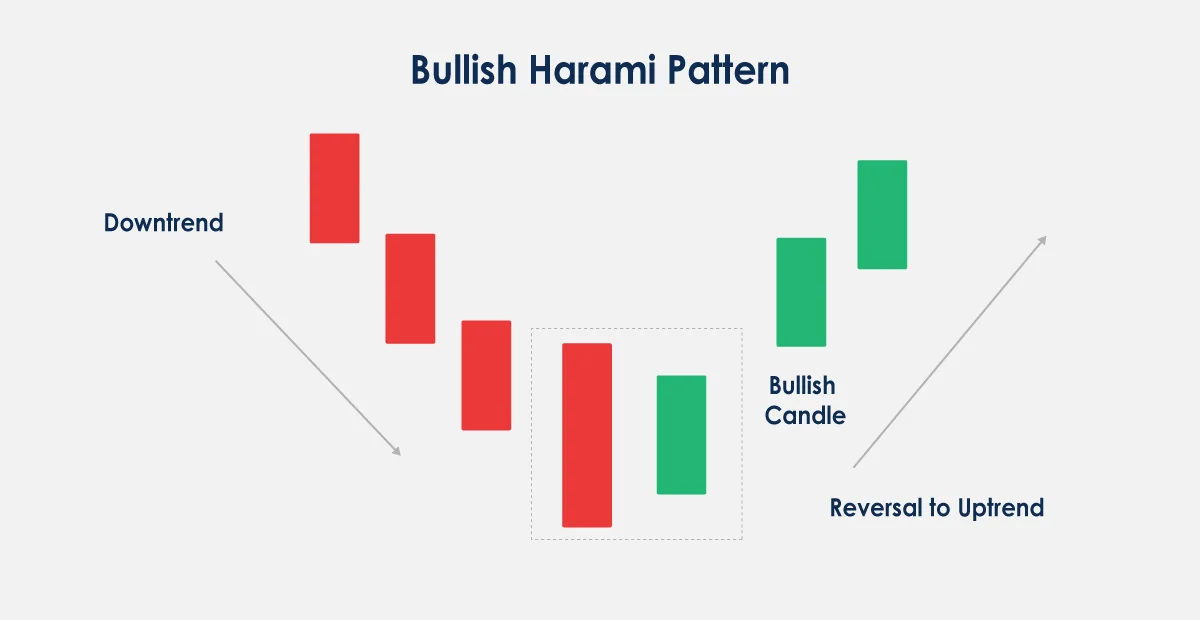
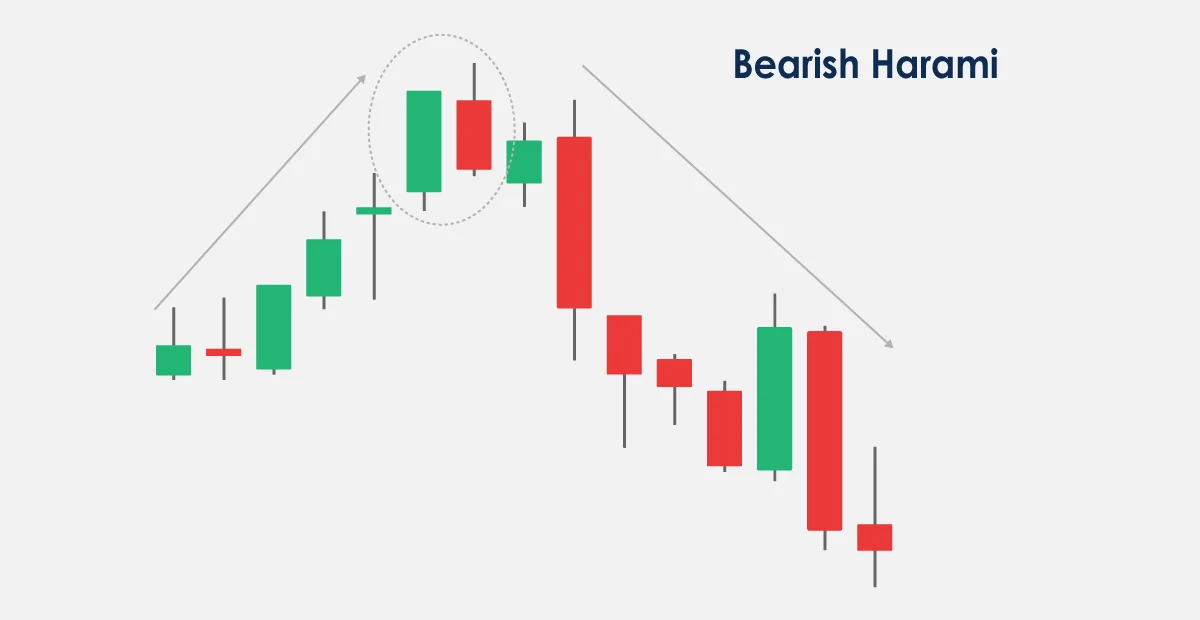
Harami
Harami patterns occur when a small candle with a short body is contained within the body of a larger candle. It can indicate a potential reversal or continuation of the current trend.
Bullish and Bearish Patterns
Candlestick patterns can be classified as either bullish or bearish, depending on whether they indicate a potential uptrend or downtrend in the market. Here are some examples of both bullish and bearish patterns:
Bullish patterns
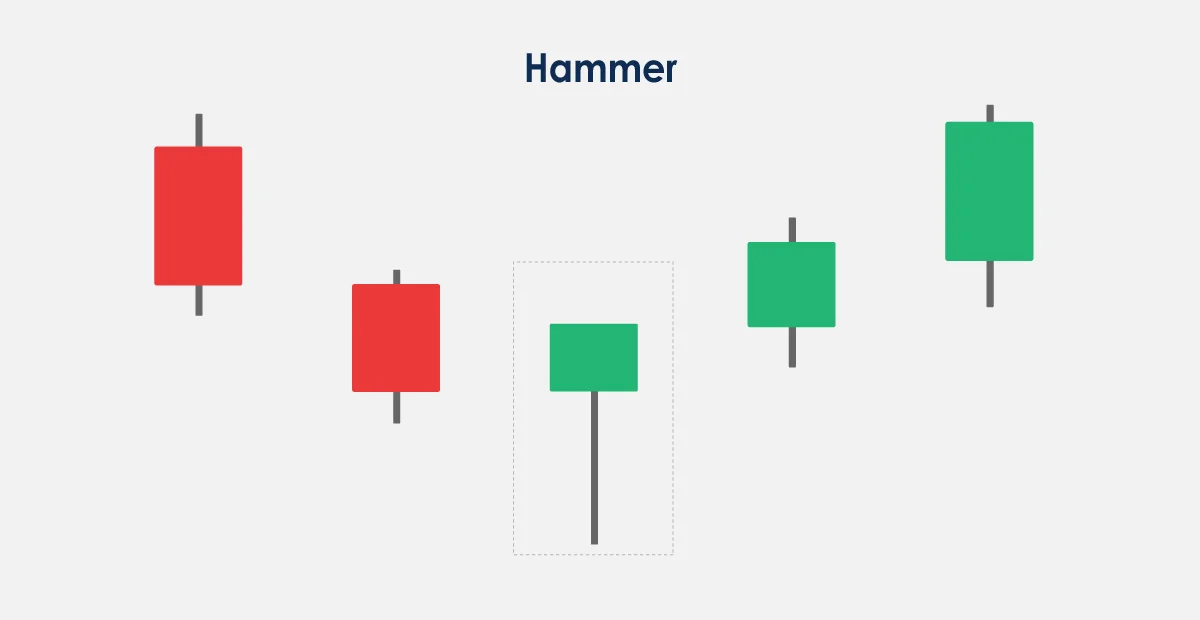
Hammer
This is a bullish reversal pattern. It usually occurs at the bottom of a downtrend. Hammer patterns are characterized by a small body and a long lower wick, indicating buyers have stepped in and pushed prices up.
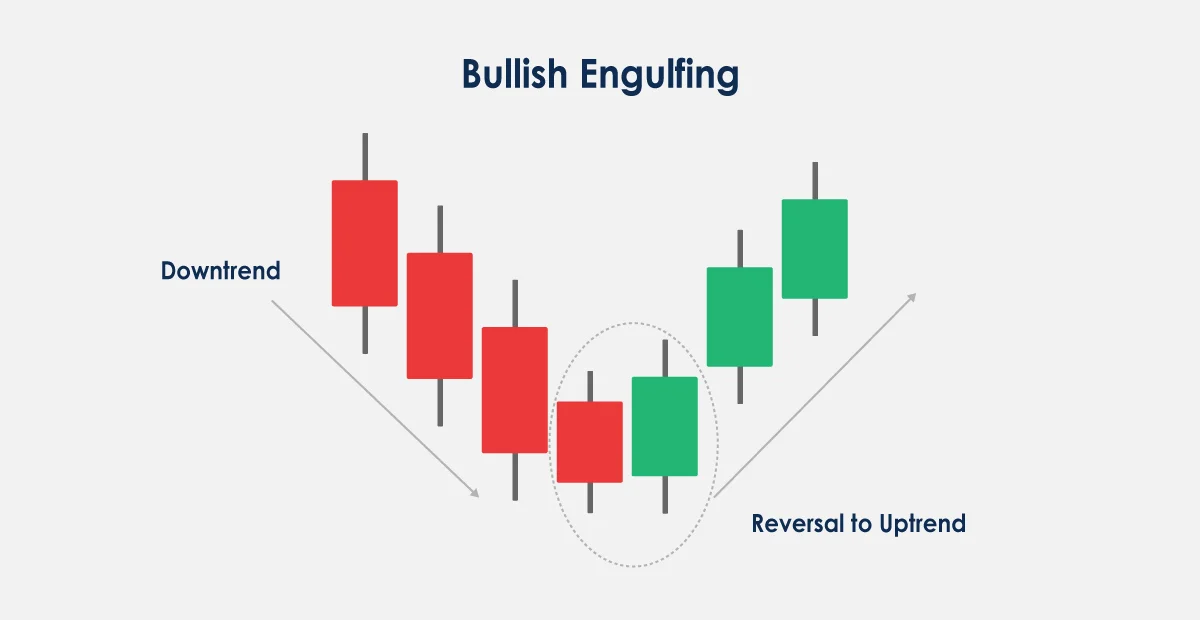
Bullish Engulfing
A bullish engulfing pattern occurs when a large bullish candle follows a small bearish candle. This pattern indicates that buyers have overwhelmed sellers and are pushing prices up.
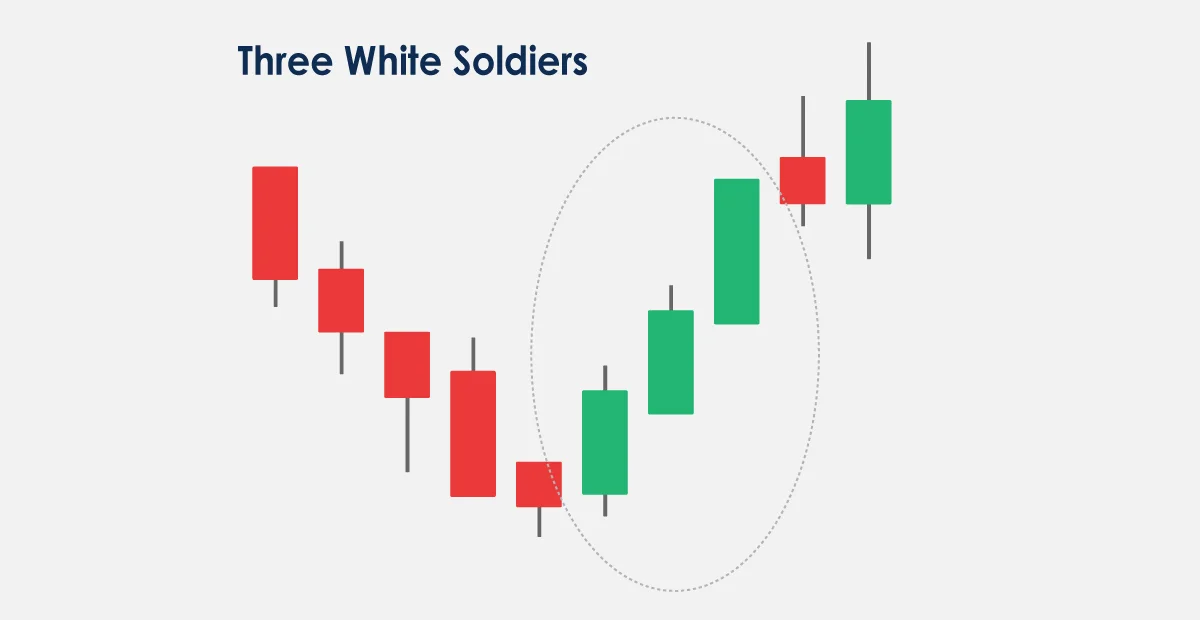
Three White Soldiers
This pattern occurs when three consecutive bullish candlesticks appear on the chart. This pattern indicates a strong uptrend and is a bullish signal.
Morning Star
This three-candle pattern begins with a large red candle, followed by a small-bodied candle that gaps down and concludes with a large green candle that fits within the body of the first candle. This sequence indicates a shift in sentiment from bearish candlestick to bullish.
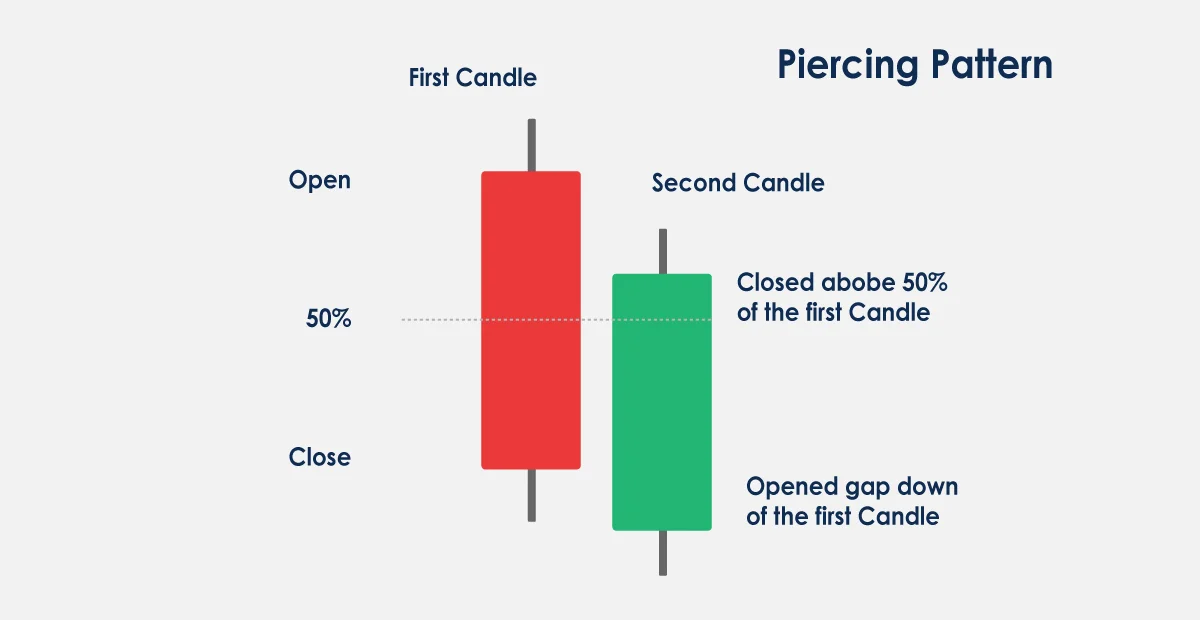
Piercing Line
This pattern consists of two candles in a downtrend: the first is a long red candle, and the second is a long green candle that starts at a new low but closes above the midpoint of the first candle. It suggests a potential bullish reversal.
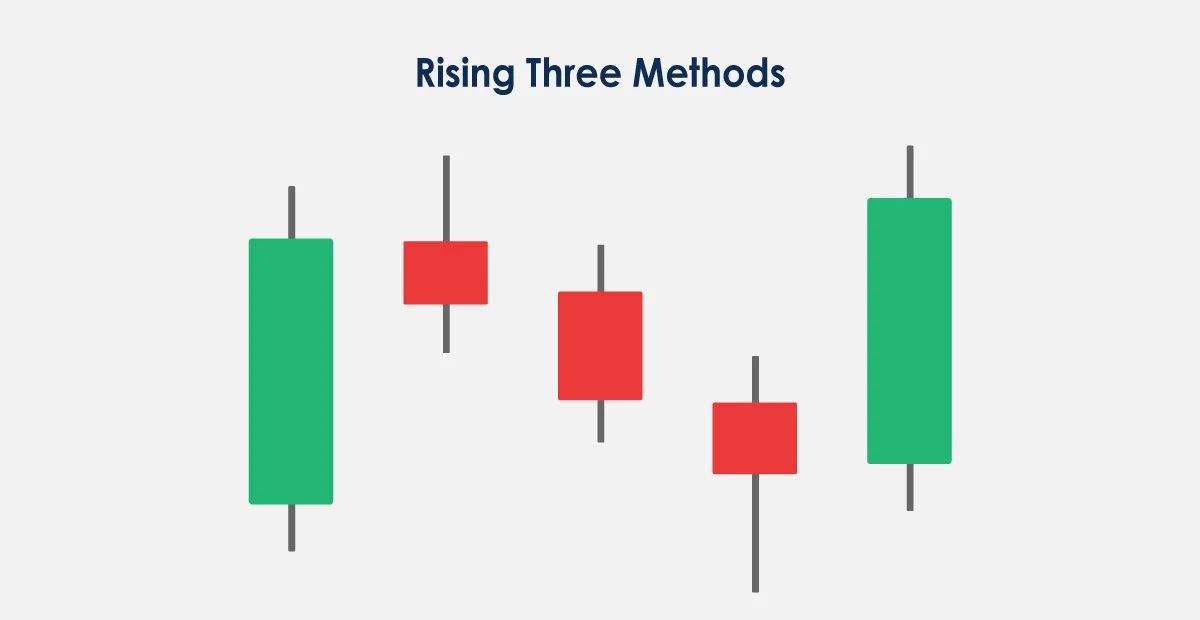
Rising Three Methods
The Rising Methods pattern begins with a long green candle, followed by three small-bodied candles that remain within the range of the first green candle and concludes with another long green candle. This pattern suggests the continuation of the current upward trend.
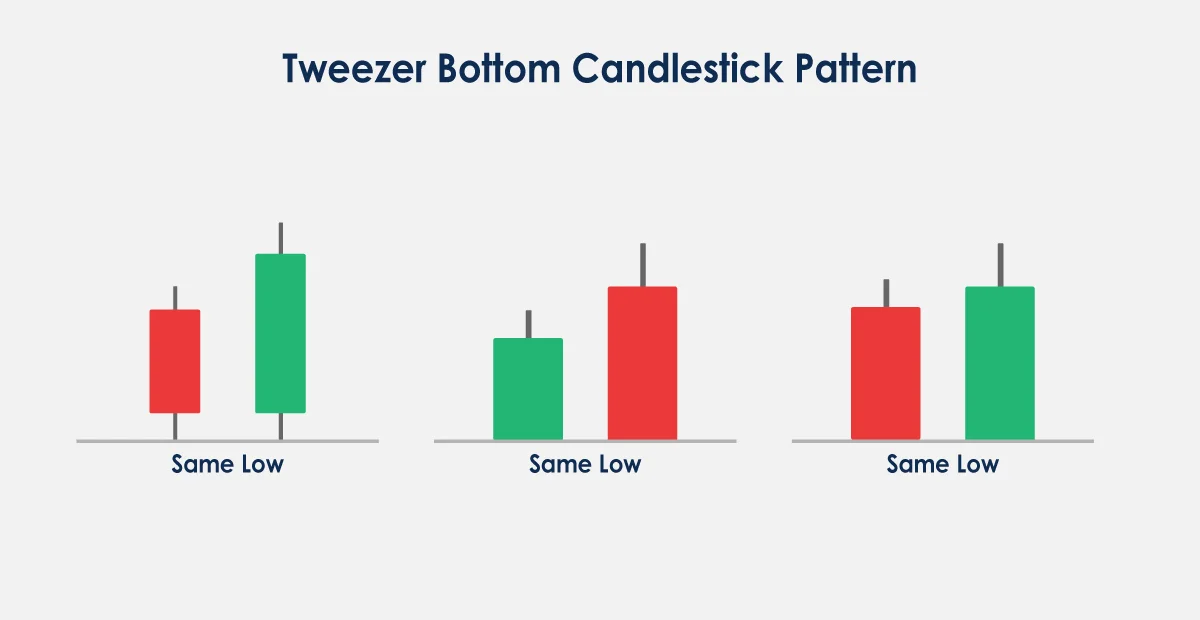
Tweezer Bottoms
Tweezer bottoms feature two consecutive candles with almost identical lows. It typically appears during a downtrend, suggesting a bullish reversal is imminent.
Bearish patterns
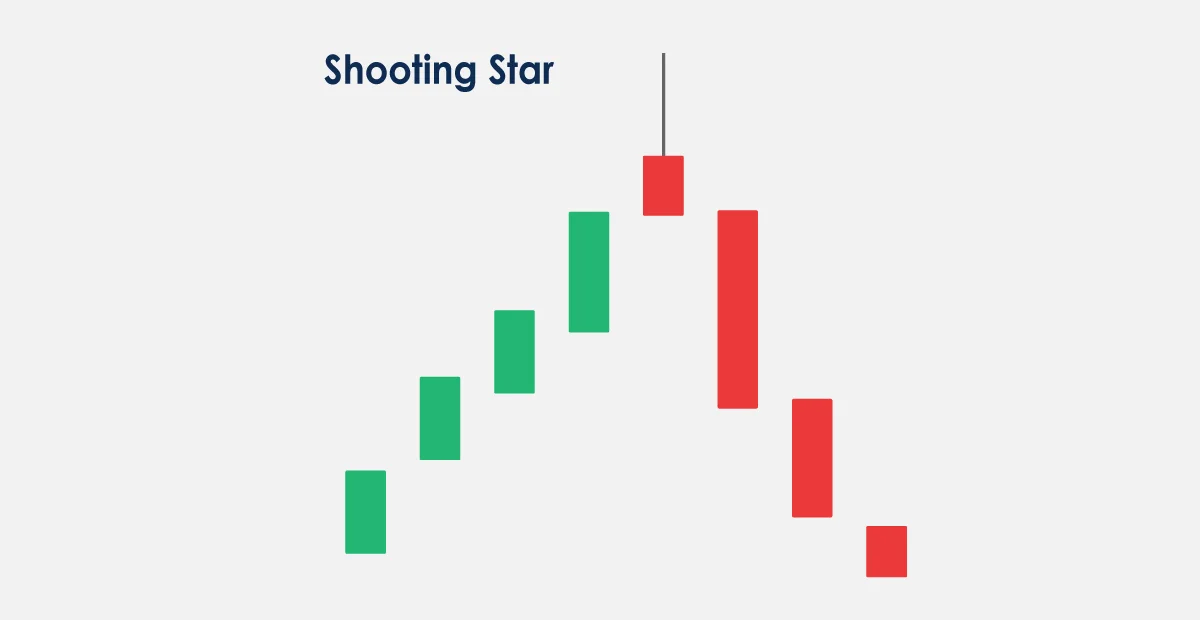
Shooting Star
This is a bearish reversal pattern. It occurs at the top of an uptrend. The candlestick is characterized by a small body and a long upper wick, indicating that sellers have stepped in and pushed prices down.
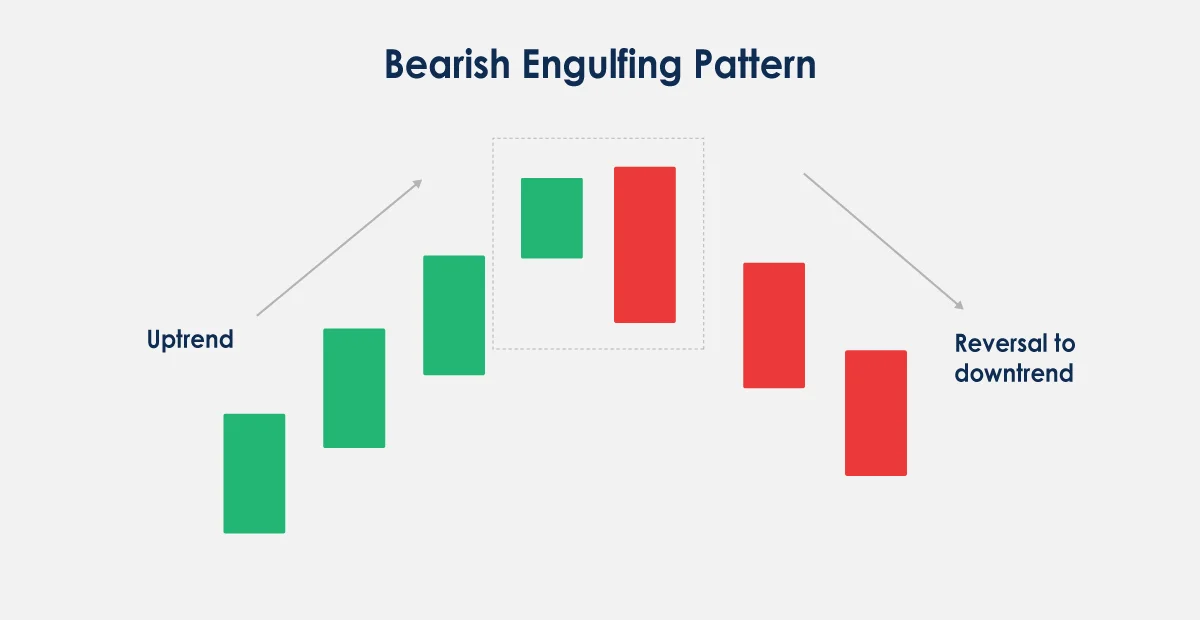
Bearish Engulfing
A bearish engulfing pattern occurs when a large bearish candle follows a small bullish candle. This pattern indicates that sellers have overwhelmed buyers and are pushing prices down.
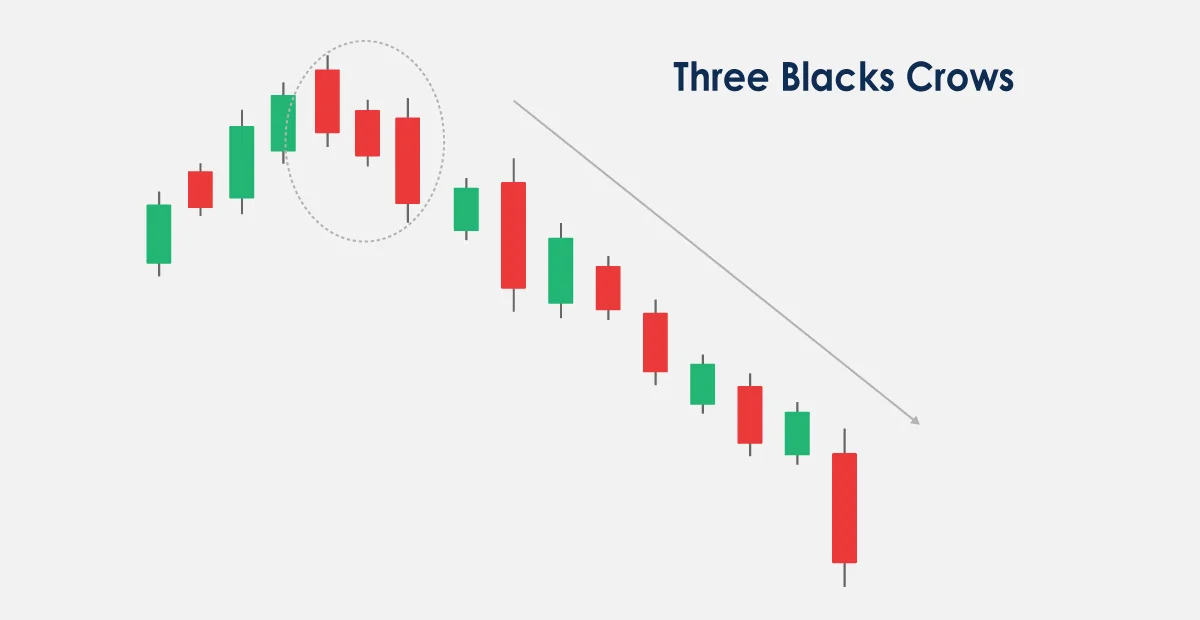
Three Black Crows
This pattern occurs when three consecutive bearish candlesticks appear on the chart. This pattern indicates a strong downtrend and is a bearish signal.
Understanding these and other bullish and bearish patterns will help you gain valuable insights into market trends and potential trading opportunities. However, it's important to note that candlestick patterns should be used in conjunction with other technical indicators and market analysis.
Reading Candlestick Charts for Trading
Candlestick charts provide valuable insights into market trends, which you can use to make smarter trading decisions. Here's how to use candlestick charts to identify trends:
Identify the overall trend
The first step is to identify the market's overall trend. Are prices generally trending upwards, downwards, or sideways? This can be determined by looking at the long-term chart and identifying whether the chart is forming higher highs or lower lows.
Look for patterns
Next, look for patterns on the candlestick chart that indicate the strength of the trend. Bullish patterns such as hammers, bullish engulfing patterns, or morning stars indicate an upward trend. In contrast, bearish patterns such as shooting stars, bearish engulfing patterns, or evening stars indicate a downward trend.
Check the volume
Volume is an important factor in determining the strength of a trend. A high volume of trades during a particular candlestick period indicates that the trend will likely continue.
Identify support and resistance levels
This can help traders to identify potential entry and exit points. These levels can be identified by looking for areas where the price has previously bounced back up (support) or fallen back down (resistance).
Pros and Cons of Candlestick Patterns
Candlestick patterns are widely utilized in technical analysis to forecast future price movements by analyzing historical market behavior. Recognizing the strengths and limitations of these patterns is essential for integrating them effectively into a comprehensive trading strategy.
Advantages:
Visual Clarity
Candlestick charts are effective in conveying complex pricing information through simple visual representations. This allows traders to quickly assess market sentiment, price trends, and volatility by examining candlestick formations.
Immediate Insights
These patterns offer rapid insights into the prevailing psychological state of the market, aiding traders in determining whether buying or selling pressures are dominant. Such information is valuable for making swift trading decisions.
Enhanced Trading Strategies
Traders often combine candlestick pattern analysis with other technical indicators, such as moving averages, RSI, and MACD—to validate signals. Integrating multiple tools can improve the robustness of trading strategies and decision-making processes.
Predictive Capability
Candlestick patterns are frequently used to identify potential market reversals or continuations. Recognizable formations like the Bullish Engulfing and Bearish Harami can signal upcoming trend shifts, enabling traders to capitalize on prospective market movements.
Limitations
Subjectivity
One challenge with candlestick patterns is their subjective interpretation. Different traders may interpret the same pattern differently, and there can be ambiguity about the precise criteria that define specific formations. This variability can lead to inconsistent trading outcomes.
False Signals
As with all technical indicators, candlestick patterns can sometimes produce false signals. Market behavior may differ from what the patterns suggest due to unforeseen factors such as economic news, sentiment shifts, or external events, potentially resulting in losses.
Requires Experience
Effective use of candlestick patterns necessitates significant experience and understanding. Novice traders might find it difficult to accurately identify patterns and interpret their implications without adequate practice.
Overreliance Risk
There is a potential risk of overdependence on candlestick patterns, leading traders to overlook other critical aspects of trading—such as fundamental analysis, current market conditions, and news events. Such overreliance can result in poorly informed trading decisions.
Common Mistakes to Avoid
Now we know about the pros and cons of the Candlestick Charts and the fact that you know this popular form of technical analysis can provide valuable insights into market trends. There are still some mistakes you should avoid when referring to candlestick charts.
Over-reliance on Candlestick Patterns
Like mentioned above, candlestick patterns are just a tool. Over-reliance on candlestick patterns and ignoring other technical indicators and market analysis can lead to inaccurate predictions and poor trading decisions. Once you're confident, you understand the tool and how to apply it, move on to other technical analysis tools and expand your abilities as a trader.
Failure to Use Stop-Loss Orders
Stop-loss orders are used to limit losses when a trade goes against your expectations. Failure to use stop-loss orders can result in significant losses, especially when trading volatile markets such as cryptocurrencies.
Failure to Practice Proper Risk Management
Proper risk management is essential for successful trading. You shouldn't risk more than you can afford to lose and should always have a plan in place for managing risk.
Ignoring Market Trends
Ignoring market trends can lead to poor trading decisions. Therefore, it's important to pay attention to overall market trends and use them to inform your trading strategy. That could mean zooming out on the charts to look at the trending sentiment across a longer time period, equipping you with an understanding of the wider context surrounding recent price movement.
Conclusion
Candlestick charts are valuable tools for analyzing market trends and informing trading decisions in the cryptocurrency market. By recognizing common candlestick patterns and combining this analysis with other technical indicators and market assessments, traders can gain important insights and develop more effective trading strategies.
However, it is essential to remember that no single indicator or tool guarantees success. Effective risk management, discipline, and ongoing education are crucial components of successful trading.
Additionally, traders can enhance their performance by avoiding common pitfalls such as over-reliance on candlestick patterns, neglecting the use of stop-loss orders, and disregarding overall market trends.
CoinCatch Team
Disclaimer:
Digital asset prices carry high market risk and price volatility. You should carefully consider your investment experience, financial situation, investment objectives, and risk tolerance. CoinCatch is not responsible for any losses that may occur. This article should not be considered financial advice.