The crypto market's recent flash crash has once again exposed its extreme volatility and structural fragility. In its aftermath, traders are scrambling for tools that can decode market chaos and provide a strategic edge. Among the most powerful yet underutilized tools is the
crypto liquidity heatmap
. This advanced visual tool does more than just display price movements; it reveals the hidden forces that drive market behavior by mapping out liquidity concentrations and potential liquidation zones. For traders navigating the turbulent post-crash landscape, heatmaps offer something invaluable:
a predictive lens
through which to anticipate price movements, identify critical support and resistance levels, and understand where market liquidations might trigger the next cascade of volatility. This article explores how liquidity heatmaps can transform your trading strategy, turning market uncertainty into an actionable opportunity.
What Is a Crypto Liquidity Heatmap?
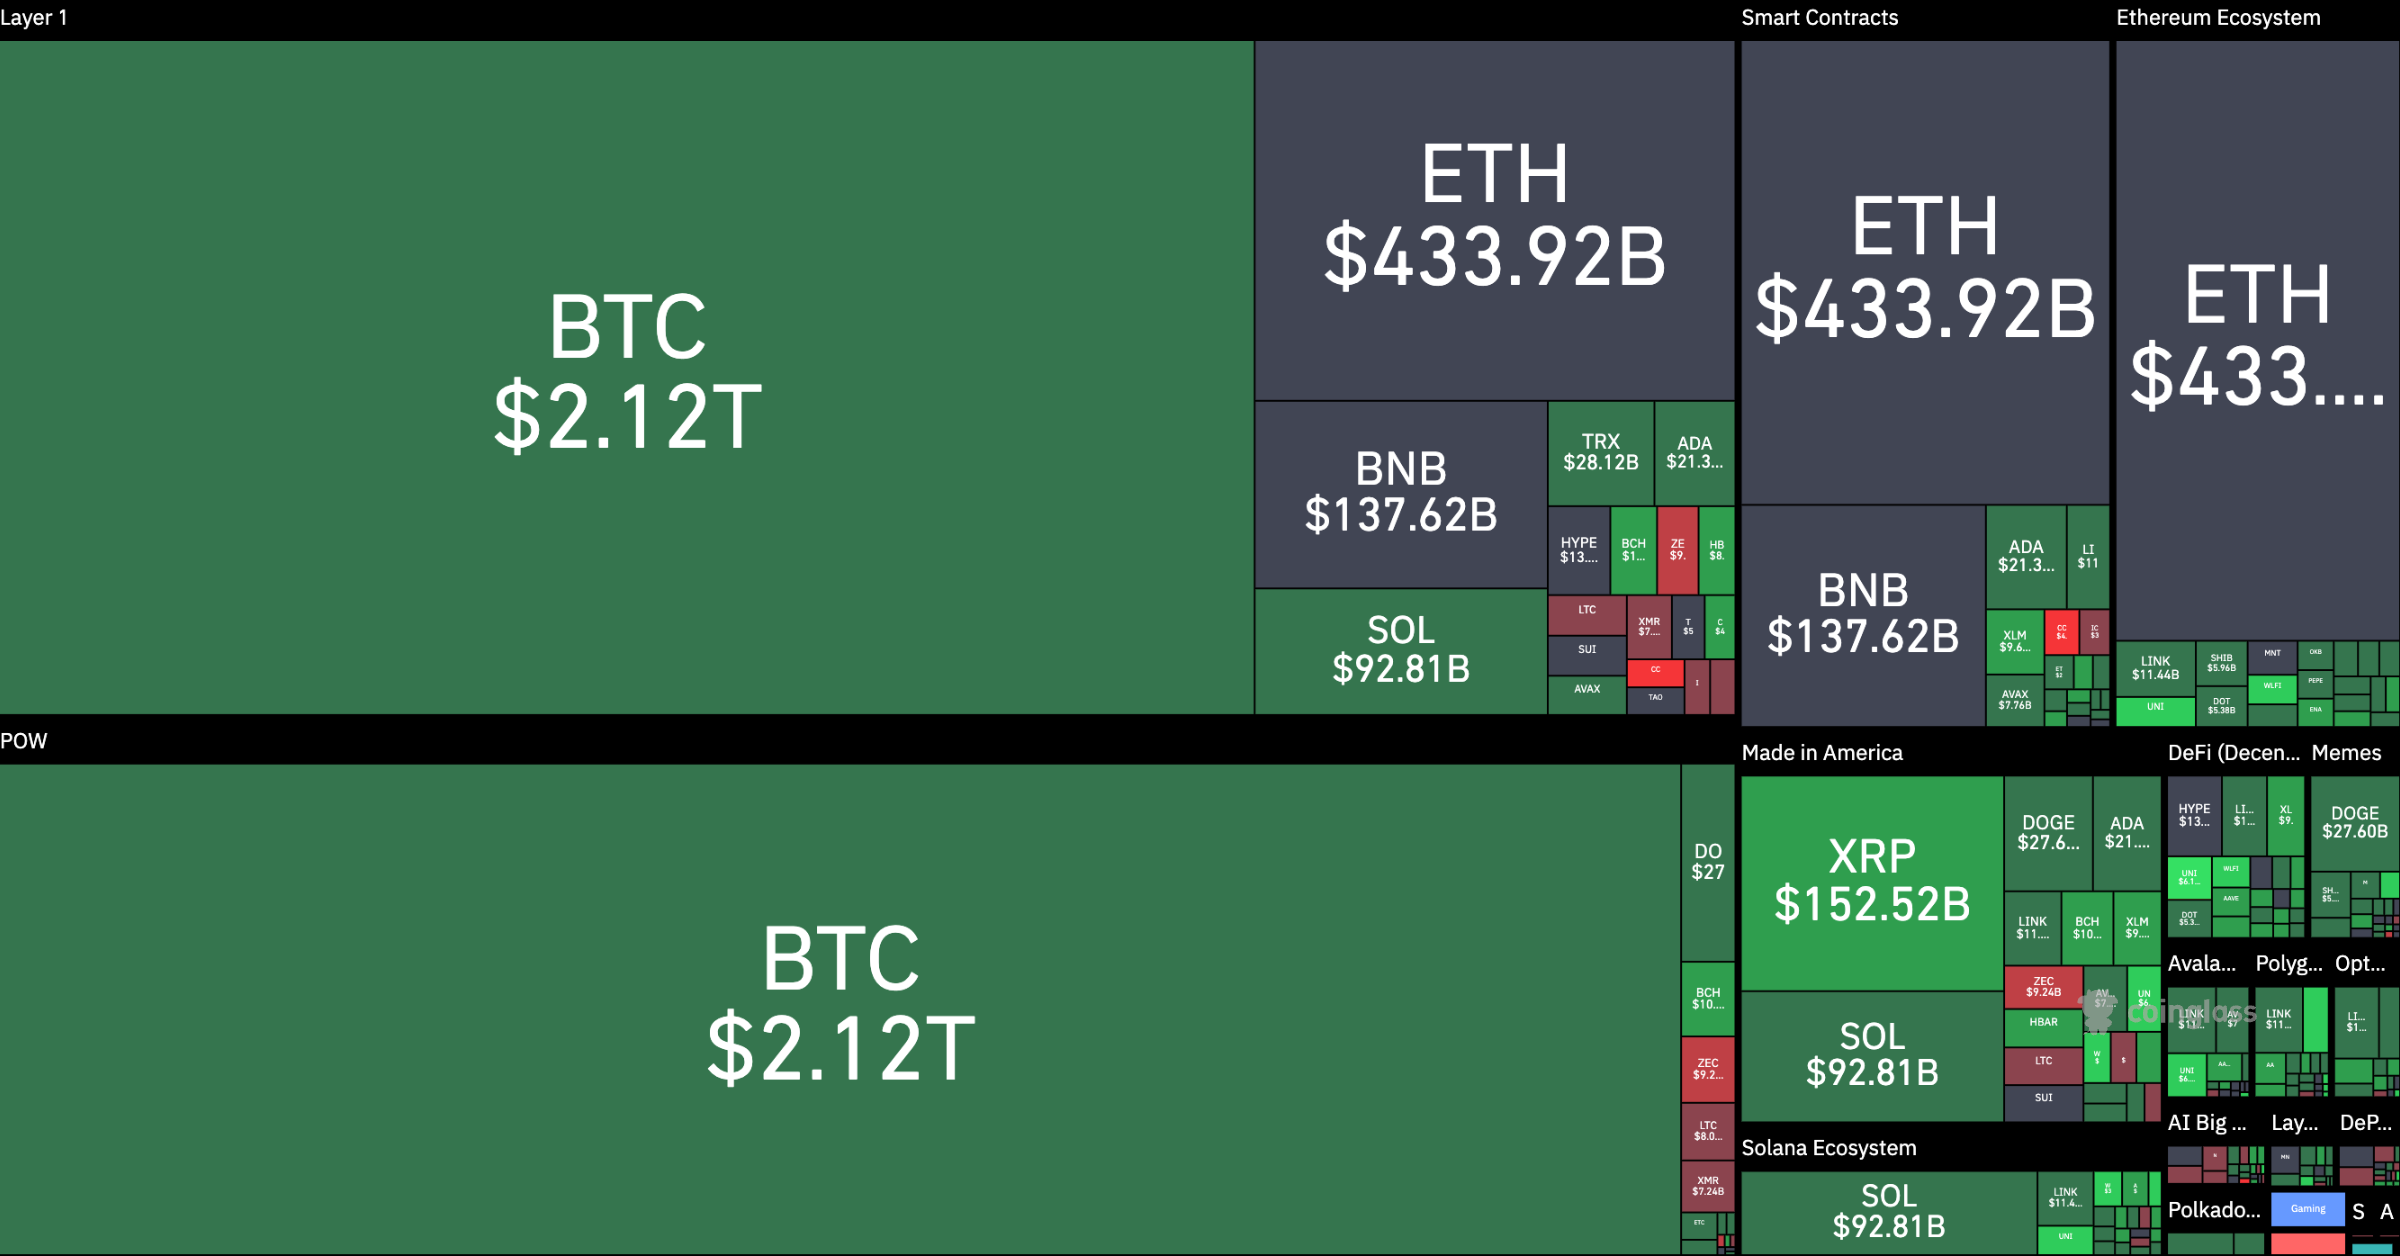
Market Cap heatmap. Source: Coinglass
A heatmap is a visual chart that uses varying shades or hues of color to intuitively display the density and intensity of data. In cryptocurrency trading, it specializes in liquidity heatmaps and liquidation heatmaps, which transform the market forces hidden in order books and leverage data—namely, support, resistance, risk, and opportunity into an intuitive color map. It is a key tool for modern traders to understand the deep structure of the market and make more informed decisions.
Liquidity Heatmaps:
BTC liquidity heatmap. Source: Coinglass
The Liquidity Heatmap is an advanced analytical tool designed to visualize market depth, order distribution, and liquidity structure.
It maps the bid/ask density from the order book across different price levels, representing areas of liquidity concentration and fund flow intensity through color gradients.
This indicator helps traders, analysts, and institutions identify liquidity clusters, potential support and resistance zones, and liquidity voids (gaps) — offer key insights into the microstructure of the market and the real positioning of capital.
How It Works
The Liquidity Heatmap is built using Level 2 order book data, which records all visible buy and sell limit orders in real time.
It converts the aggregated order volume at each price level into heat intensity values, then visualizes them as a color-coded map that updates continuously.
X-Axis (Horizontal): Time — showing how liquidity evolves over time.
Y-Axis (Vertical): Price — displaying the distribution of order depth across price levels.
Color Gradient (Heat Intensity): Represents liquidity strength.
Darker / warmer colors → high liquidity, dense orders (strong support/resistance)
Lighter / cooler colors → low liquidity, thin depth (more volatile or breakout-prone zones)
The system updates dynamically to reflect the order book changes the creation, cancellation, or shifting of orders, allowing traders to observe how liquidity actually behaves as market conditions evolve.
Data Structure and Computation
Data Source: Real-time Level 2 order book data from major exchanges (both bids and asks).
Sampling Frequency: Usually millisecond to second level, ensuring high accuracy and responsiveness.
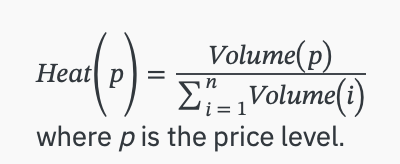
Heat Calculation:
Smoothing Algorithm: Data is often smoothed using exponential or Gaussian weighting to improve readability.
Color Mapping: Heat intensity values are transformed into a color spectrum to form the heatmap matrix.
How can traders use it?
Take BTCUSDT for example, a bright band at $105,000 signals a strong buy wall (potential support), while a bright cluster at $108,000 flags resistance. Unlike raw order book data, heatmaps make depth intuitive, revealing liquidity’s role in price action.
For example, as of November 11, 2025, bright bands are observed at the price levels of $99k, $106k, and $110k in the image below. Therefore, these price levels can somehow serve as potential support levels.
In order flow trading, which tracks real-time buy/sell dynamics, heatmaps bridge the gap between static order books and executed trades. They show where liquidity sits and how it’s consumed, helping traders predict momentum shifts or reversals. Post-1011 flash crash, with leverage fears lingering, heatmaps have surged in popularity. They’re especially vital for BTCUSDT, where whale moves and thin books can spark 5-10% swings in hours.
Liquidation Heatmaps:
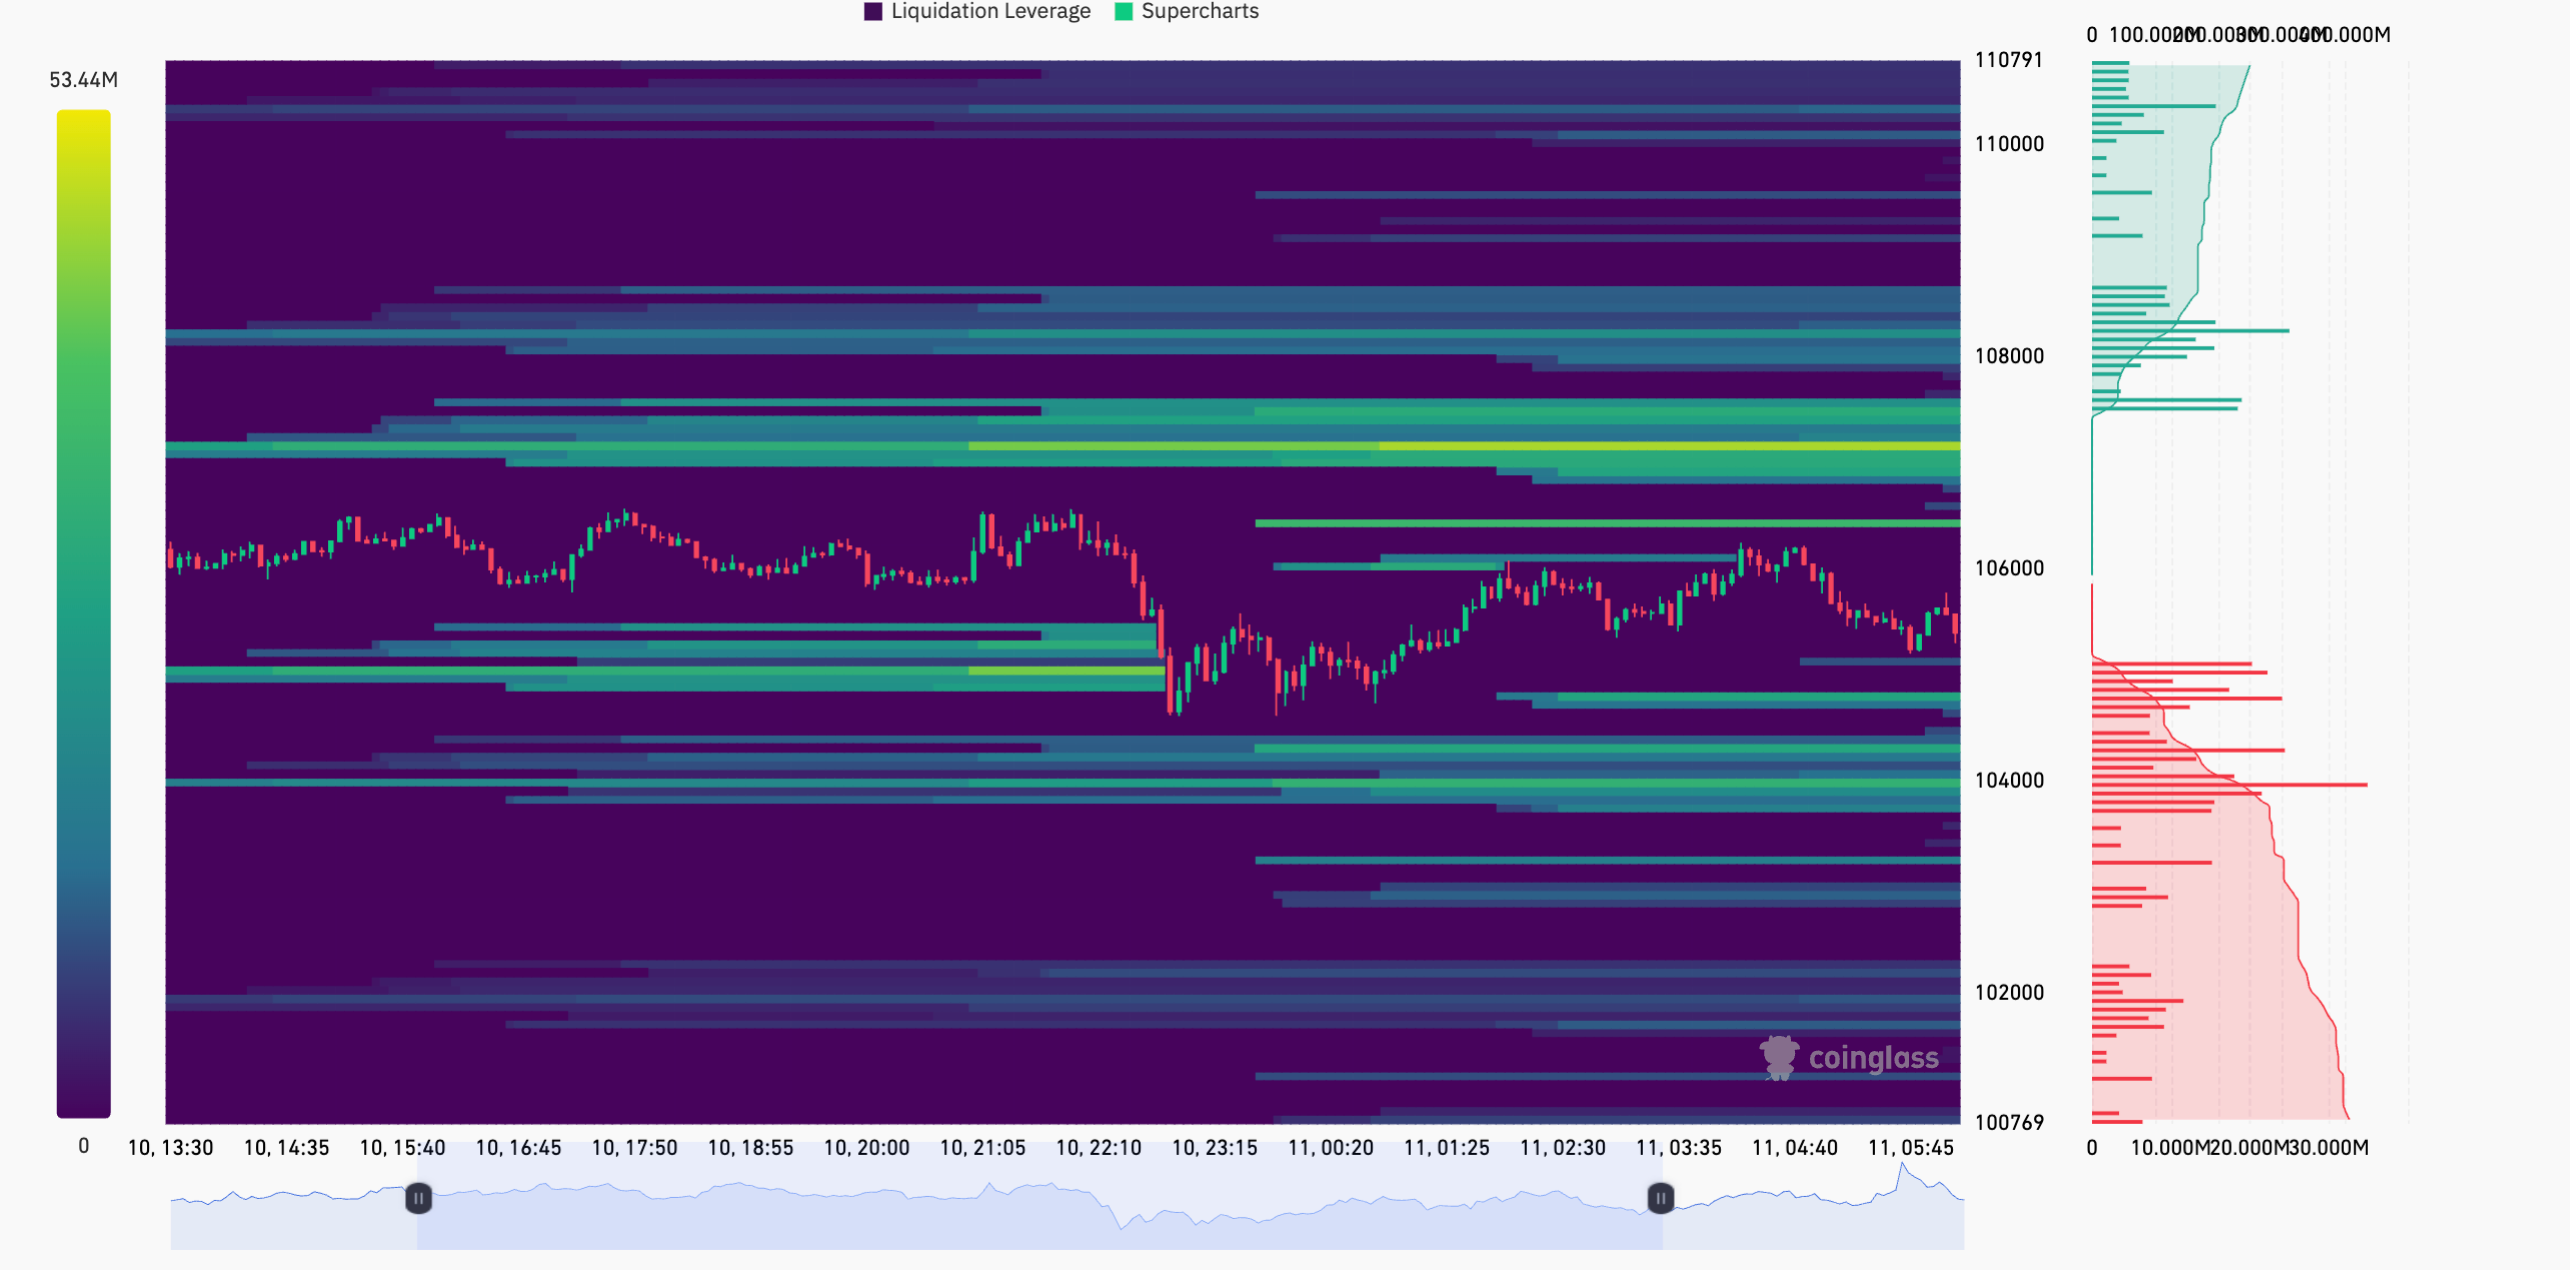
Binance BTC liquidation heatmap. Source: Coinglass
In short, liquidation heatmap predicts the price levels at which large-scale liquidation events may occur.
A liquidation event occurs when a trader's positions are closed due to price fluctuations and their margin account balance is insufficient to cover the open positions. To prevent further losses for both traders and exchanges, most exchanges offer a liquidation level, which is the price at which leveraged trades will be forcibly closed.
Traders who can estimate the liquidation levels of other traders may gain an advantage similar to understanding high liquidity in the order book.
The liquidation heatmap calculates the liquidation levels based on market data and different leverage amounts. The calculated levels are then added to the prices on the chart. As more estimated liquidation levels are added to a particular price, the colors on the heatmap change. The color range goes from purple to yellow, with yellow representing a high number of predicted liquidation levels, allowing traders to identify areas of high liquidity.
The liquidation heatmap predicts where liquidation levels are likely to initiate but not where they will stop. Therefore, the actual number of liquidations will be fewer. When considering the size, it must be viewed as a relative figure by comparing it with other levels. Users can filter multiple major exchanges, trading pairs, and historical liquidation data.
How can traders use it?
The liquidation heat map allows traders to identify areas of high liquidity, which can be helpful in various ways:
Magnet Zone: Concentration of potential liquidation levels within a specific price range may indicate that the price is likely to move towards that zone. Some traders utilize these liquidation levels to gauge the possible direction of price movement and as additional indicators for convergence.
Support/Resistance Zone: In high liquidation areas, larger traders or "whales" can execute trades rapidly at favorable prices. Once they enter or exit orders within this liquidity, the price can now reverse.
Furthermore, liquidation levels can exert significant pressure on either the buy or sell side of the order book, leading to a natural price reversal.
Liquidations play a crucial role in the cryptocurrency market as they have a significant impact on traders' positions. By understanding how to utilize data from the liquidation heat map, traders can make informed trading decisions and potentially increase their chances of success.
Why Liquidity Is Crypto's Lifeblood
Liquidity represents the
ease with which assets can be bought or sold without significantly affecting their price. In crypto markets, it serves as the fundamental lifeblood that maintains market stability and efficiency. High liquidity markets feature tight bid-ask spreads, minimal price slippage, and sufficient depth to absorb large orders without violent price swings.
The importance of liquidity extends far beyond simple trade execution. It determines
market health and resilience, particularly during stress events like the recent flash crash. As one analysis noted, "Liquidity determines every cryptocurrency cycle". Despite crypto's global reach and massive valuation, liquidity remains fragmented across hundreds of exchanges and trading pairs. This fragmentation creates a
false sense of market depth where assets appear liquid on paper but can experience extreme volatility during market shocks.
This structural weakness mirrors issues in traditional finance but is amplified by crypto's
24/7 operation, lower regulatory oversight, and inconsistent market making. The weekend liquidity crisis exemplifies this vulnerability – when institutional traders step back, even minor news can trigger disproportionate price movements due to thin order books.
The relationship between liquidity and market stability becomes particularly crucial in leveraged crypto trading. Liquidations can trigger
chain-reaction volatility, where forced position closures create cascading price movements that feed on themselves. Understanding liquidity concentrations helps traders anticipate these events rather than being caught by them.
How to Use Liquidity Heatmaps for BTCUSDT Trading
Identifying Key Support and Resistance Levels
Liquidity heatmaps excel at revealing
significant support and resistance levels that may not be visible on standard price charts. These represent concentrations of buy or sell orders that can either halt or reverse price movements. For example, a liquidity heatmap might show a massive cluster of buy orders at $78,000-80,000 for BTCUSDT, indicating strong support, and a dense concentration of sell orders at $84,800-87,000, marking significant resistance.
Traders can use these identified levels to
place strategic entry and exit points. Approaching a resistance zone with high liquidity might signal a potential short opportunity, while nearing a dense support region could indicate a buying opportunity.
Predicting Price Movements and Magnet Effects
Heatmaps reveal what traders call "
magnet zones" – price levels with such high liquidity that they actively attract price movement toward them. These zones often contain high concentrations of pending liquidations that market makers may target. As one analysis explains, "Large traders or 'whales' can often utilize the market's liquidity advantages to execute buy or sell operations at relatively low cost".
For BTCUSDT trading, this means the price often moves toward high-liquidity regions regardless of the prevailing trend. A heatmap might show a bright white zone at $110,000, suggesting price is likely to test that level even if it's currently trading lower. Recognizing these magnet zones allows traders to
position ahead of expected price movements rather than chasing them.
Strategic Entry, Exit, and Risk Management
Beyond predicting directions, heatmaps provide practical tools for
entry timing and risk management. For instance:
-
When a high-liquidity support zone is identified below the current price, traders might place limit buy orders near that zone with stop-losses just below it.
-
Similarly, approaching a high-liquidity resistance area might trigger profit-taking or short positions with stops above the zone.
The heatmap colors intuitively guide position sizing – brighter, denser regions suggest stronger levels where larger positions might be justified, while weaker color regions might warrant smaller allocations or tighter stops.
Limitations and Best Practices
Critical Limitations of Heatmaps
While powerful, liquidity heatmaps have significant limitations that traders must acknowledge:
-
Potential Manipulation: The order book data underlying liquidity heatmaps can be manipulated. Large traders can place and suddenly withdraw substantial orders, creating false liquidity signals. What appears to be strong support might vanish moments before the price tests the level.
-
Static Snapshot: Heatmaps show pending orders at a specific moment, but crypto markets change rapidly. As one experienced trader noted, "I have been hurt multiple times for believing in 'strong support levels' that disappeared like morning fog when tested".
-
Incomplete Picture: Heatmaps don't capture all market dynamics. They may show retail trader concentrations but miss institutional activity occurring through dark pools or alternative venues.
-
No Directional Certainty: While heatmaps show where liquidity exists, they don't guarantee how the price will behave when it arrives. Sometimes liquidity clusters act as support/resistance, but other times they break easily under strong momentum.
Essential Best Practices
To maximize effectiveness while mitigating risks:
-
Use Complementary Indicators: Combine heatmaps with technical analysis tools like RSI, MACD, and volume profiles for confirmation. Funding rates and long/short ratios can also validate heatmap signals.
-
Contextualize Time Frames: Adjust heatmap settings to match your trading style. Short-term traders might use 1-4 hour views, while longer-term investors might analyze weekly or monthly liquidity distributions.
-
Verify with Price Action: Wait for price confirmation when approaching key liquidity zones. A bounce off support or rejection at resistance validates the heatmap reading.
-
Maintain Healthy Skepticism: Treat heatmaps as informative guides rather than definitive signals. As one trader advised, "Learn to use these charts to understand where the crowd is positioned, and then bet against their expectations".
Why Heatmaps Are Your Post-Crash Edge
In the vulnerable period following a flash crash, liquidity heatmaps provide
unique analytical advantages that conventional charts cannot match.
First, they reveal where
cascading liquidations might occur as markets stabilize. Post-crash markets often experience elevated leverage as traders attempt to recoup losses, creating new liquidation clusters that heatmaps can identify before they trigger.
Second, heatmaps help identify where
market liquidity has fled during the crash. The fragmentation of crypto liquidity across exchanges means that post-shock recovery patterns vary significantly between platforms. Heatmaps can pinpoint where genuine liquidity has returned versus where it remains thin.
Third, they expose
institutional positioning through liquidity concentrations. Large players often establish positions at key levels during market dislocations, and these accumulations appear as unusual liquidity clusters on heatmaps.
Most importantly, heatmaps provide a
psychological advantage when fear dominates market sentiment. They offer concrete data about where significant buy and sell interest actually exists, helping traders avoid emotional decisions and instead trade based on measurable market structure.
As one platform described their market visualization tool, it "condenses disparate data into an impartial, comparable view, allowing you to see the overall architecture, spot anomalies, and contribute to swift action". This capability becomes exponentially more valuable when navigating the confused, volatile trading environments that typically follow major market crashes.
Conclusion
Liquidity heatmaps represent a significant evolution in crypto trading analysis, moving beyond simple price and volume metrics to visualize the
hidden market forces that actually drive price action. While not infallible, they provide crucial insights into liquidation risks, support/resistance levels, and potential price magnet zones.
The true power of heatmaps emerges when they're
integrated into a comprehensive trading approach that includes technical analysis, risk management, and market fundamentals. Used wisely, they can help traders anticipate market movements, avoid liquidation traps, and identify high-probability trading opportunities – particularly valuable capabilities in turbulent periods following market crashes.
As crypto markets mature and leverage increases, understanding liquidity dynamics becomes increasingly essential. Liquidity heatmaps offer a window into these dynamics, transforming abstract market data into
actionable intelligencefor smarter, more informed trading decisions.
Reference: