EMA, short for Exponential Moving Average, is a trend-based technical indicator. Investors typically use EMAs as support and resistance lines during trading. They also combine short-term and long-term EMAs to predict future price trends.
In cryptocurrency trading, investors often use technical indicators to judge future market trends and help them formulate trading strategies.
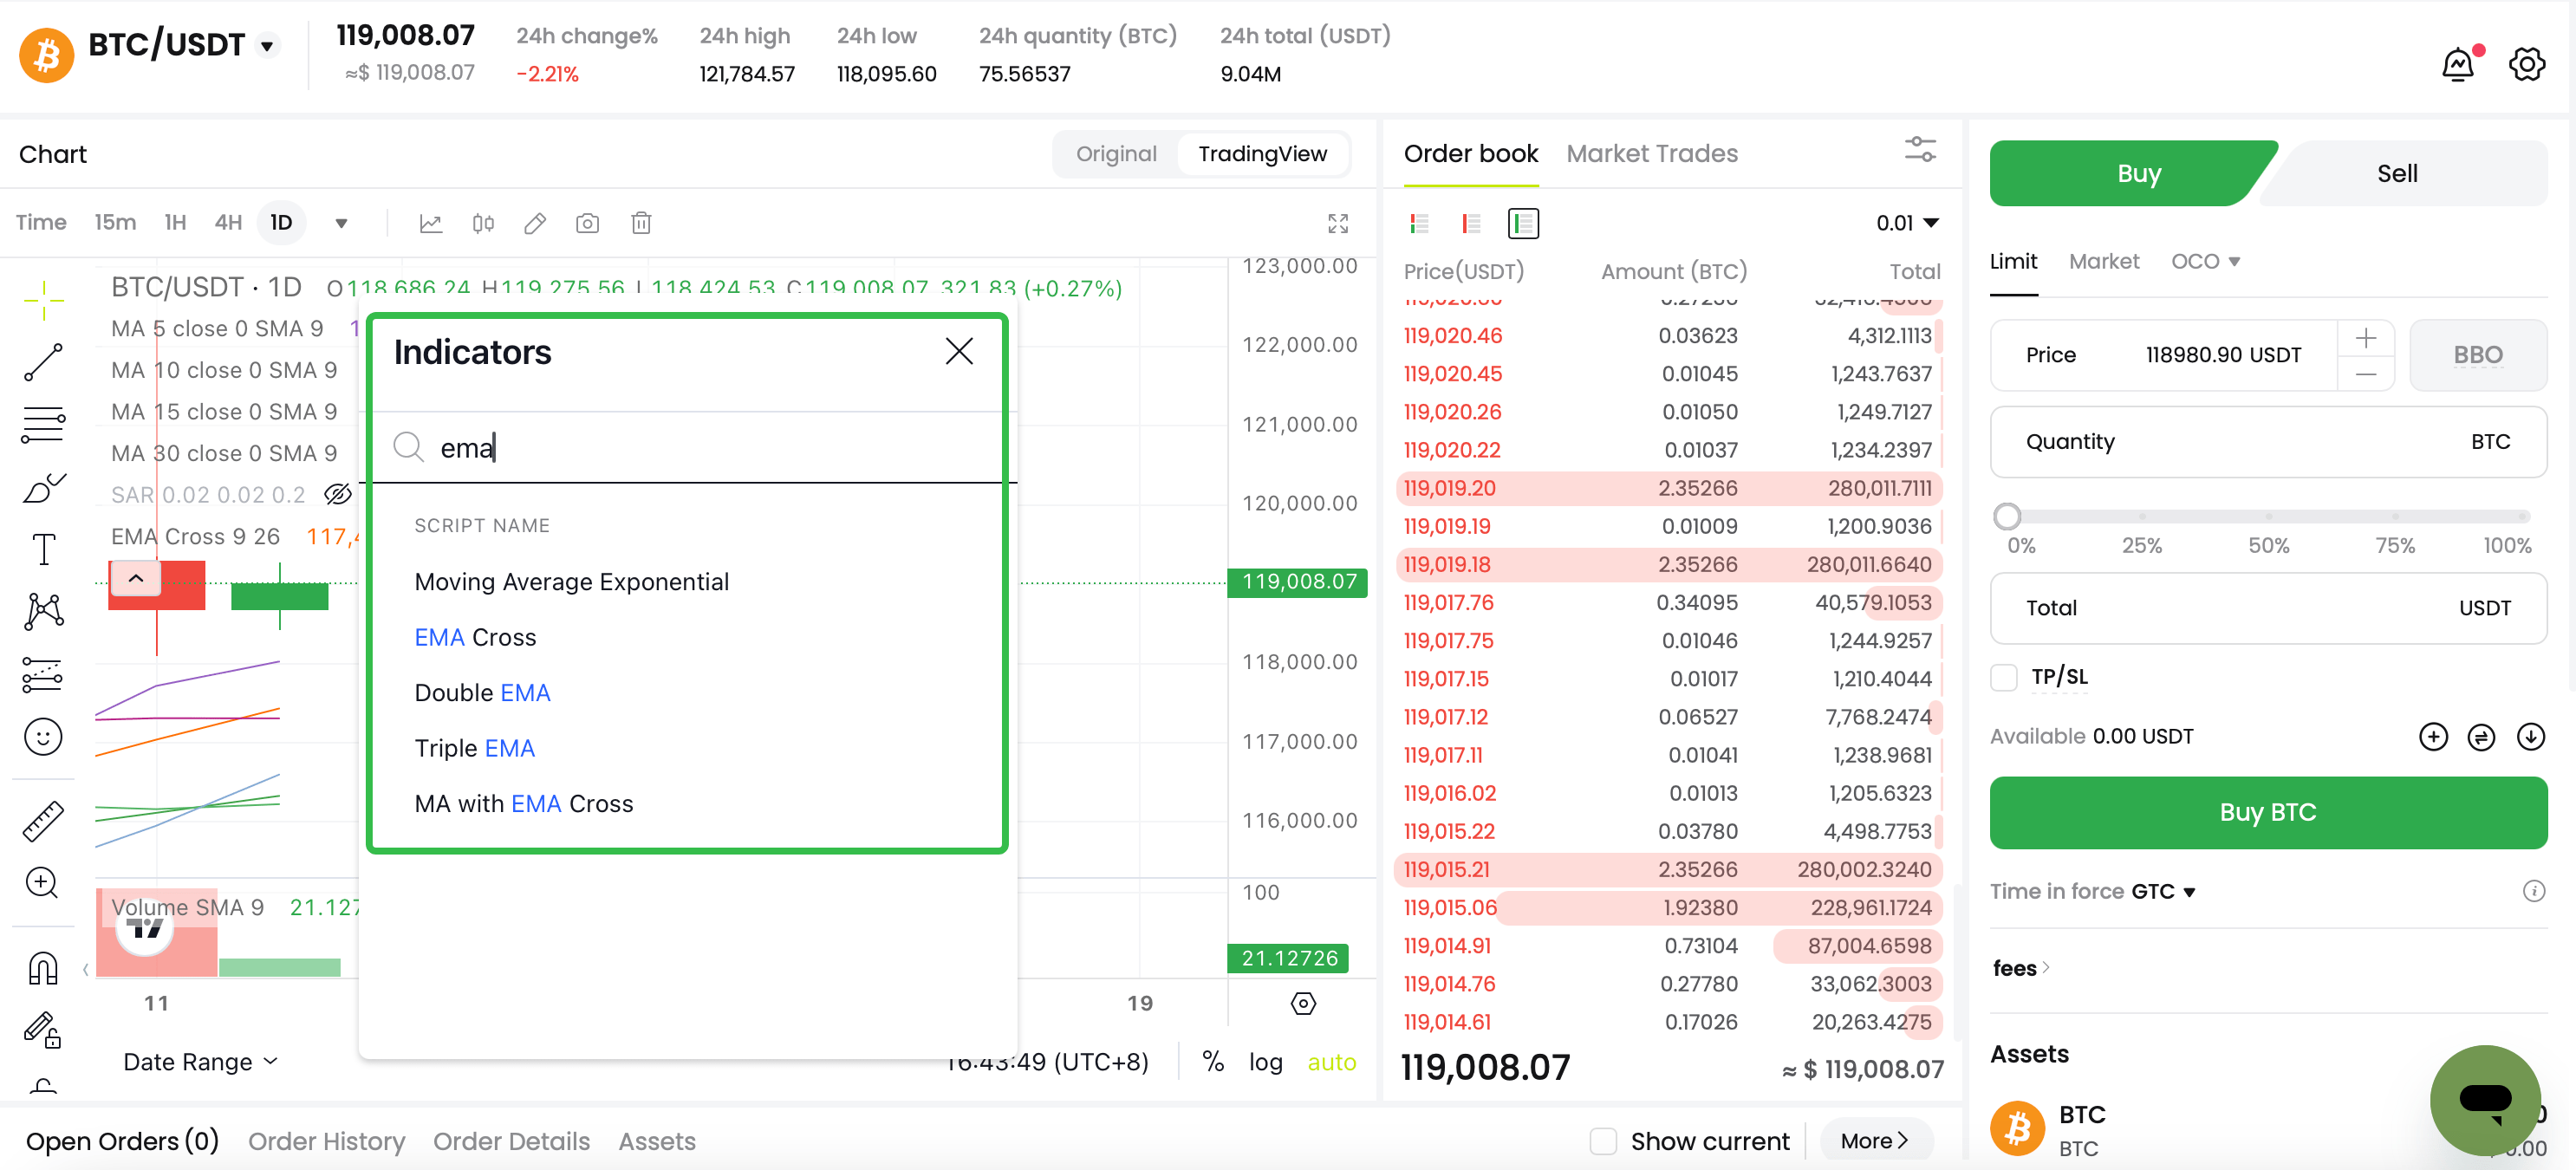
CoinCatch provides a number of basic technical indicator tools. You can click on the "Technical Indicators" icon in the professional version of the candlestick chart interface to pop up a window of indicators for selection. The most commonly used technical indicators include EMA, MACD, RSI, etc.
Application in Cryptocurrency Trading
Trend Identification: EMAs are widely used to identify the direction and strength of cryptocurrency price trends. By comparing the current price to the EMA, traders can determine whether the market is in an uptrend or downtrend. This information helps them make informed cryptocurrency buying and selling decisions.
Entry and Exit Points: Traders often use EMAs to identify potential trade entry and exit points. When the price breaks above or below an EMA, it can serve as an entry or exit signal. For example, a break above an EMA could generate a bullish signal, indicating a potential buying opportunity.
Moving Average Crossovers: Traders often use EMA crossovers to identify possible buy or sell opportunities. When a shorter-term EMA (such as the 20-day) crosses over a longer-term EMA (such as the 50-day), it can signal a shift in market sentiment. Traders can use these crossovers to initiate trades or adjust their current positions.
EMA Definition and How to Calculate It?
EMA (Exponential Moving Average) is a technical analysis tool used in the stock and financial markets to analyze asset trends. The EMA calculation method takes a weighted average of asset prices over a certain period of time and then smoothes it. "Smoothing" here refers to the process of applying a formula to eliminate the effects of noise and volatility, making the forecast more closely aligned with market trends. EMA is often used to predict future asset price trends because it combines past and current data, making predictions more accurate.
EMA is calculated as follows:
EMA(N) = smoothing constant current price + (1 - smoothing constant) EMA(N-1), where N represents the EMA period.
The EMA calculation requires the previous EMA value and a smoothing constant. The initial EMA value is typically the first day's EMA. The smoothing constant = 2 / (N + 1). The size of the smoothing constant depends on the EMA period. A smaller period results in a larger smoothing constant, and the current price is given greater weight.
Simply put, EMA is the value generated by taking the weights of the highest and lowest prices of each day and weighing them according to the period.
Connecting the daily EMA values creates the daily EMA. In practice, you don't need to calculate the EMA yourself; the system-calculated values are displayed directly on the chart.
Usage of a Single EMA
Generally speaking, EMA can be used to determine support and resistance during trading.
During a downtrend, when the price crosses the EMA line for the first time from bottom to top, the price near the EMA line forms the first buy point. When the price pulls back to the EMA line for the first time during the upward process, it forms the second buy point. When the price falls back above the EMA line and touches the EMA line to stop falling and rise again, it forms the third buy point.
When the price moves away from the EMA line for the first time, breaks through the EMA again and then falls back to the EMA line to get support, it is the fourth buying point.
Similarly, the EMA line also has four resistance level selling points. During an uptrend, the price first breaks below the EMA line (generally, a break below the EMA occurs when the candlestick closing price falls below the EMA). At this time, the price near the EMA line forms the first selling point. If the price breaks below the EMA line and then rebounds away from the EMA line, the second selling point is formed when the price reaches the previous high. The third selling point is formed when the price rises and then falls below the EMA line for the second time. During the decline, the fourth selling point is formed when the price rebounds to the resistance level of the EMA line.
Of course, in the subsequent long downward trend, the pressure of the EMA line was reached many times, which also gave a sell signal.
Combined EMA Usage
In the cryptocurrency trading market, we often hear the terms "golden cross" or "death cross". In fact, it is a market trend signal given by the intersection of two or more lines after combining long-term and short-term lines. This kind of technology is also applicable to EMA lines.
First, set two EMA lines, one for a short period and the other for a relatively long period, such as EMA10 and EMA30 (10 represents the past 10 days, 30 represents the past 30 days). Try to choose parameters that suit your trading style.
When the shorter-term EMA crosses above the longer-term EMA, and the longer-term EMA is flat or rising, the intersection of the two lines forms a "golden cross," signaling a bullish trend. Additionally, when the shorter-term EMA falls below the longer-term EMA and quickly rises again, or when the shorter-term EMA falls close to the longer-term EMA and then rises again, these are also bullish signals.
When the short-term EMA line crosses the long-term EMA line downward, and the long-term EMA line is in a flat or declining state, the point where the two lines intersect forms a "death cross", which is a bearish trend.
It is worth noting that when the trends of the long-term line and the short-term line are not synchronized, it is very likely to be a false signal. For example, when the long-term EMA line is upward, the short-term EMA line crosses the long-term EMA line downward; or when the long-term EMA line is downward, the short-term EMA line crosses the long-term EMA line upward. These signals of unsynchronized trends may be false signals, and you should be cautious when buying or selling.
Conclusion
It’s important to note that while EMAs are valuable tools in technical analysis, they shouldn’t be used solely as a basis for trading decisions. Traders often use EMAs in conjunction with other indicators and analysis techniques to gain a comprehensive understanding of market trends and make informed trading decisions.
CoinCatch Team
Disclaimer:
Digital asset prices carry high market risk and price volatility. You should carefully consider your investment experience, financial situation, investment objectives, and risk tolerance. CoinCatch is not responsible for any losses that may occur. This article should not be considered financial advice.