Double tops and bottoms are essential chart patterns that every cryptocurrency trader should understand. These reversal patterns frequently occur in volatile markets such as cryptocurrencies and can signal potential trend changes, aiding traders in timing their entry and exit points more effectively.
In this article, you will learn how to identify and interpret double tops and bottoms within crypto charts. We will discuss how these patterns form, what they indicate regarding market direction, and how to approach trading them with increased confidence. The content includes illustrative images and a case analysis of Bitcoin’s price movements. Whether you are actively trading or new to technical analysis, this overview provides a strong foundational understanding.
What Are Double Tops and Bottoms?
Double tops and bottoms are classic price chart patterns used to signal trend reversals in financial markets—including crypto. They occur when an asset’s price tests a certain level twice, either at a high (double top) or a low (double bottom), but fails to break through decisively.
A
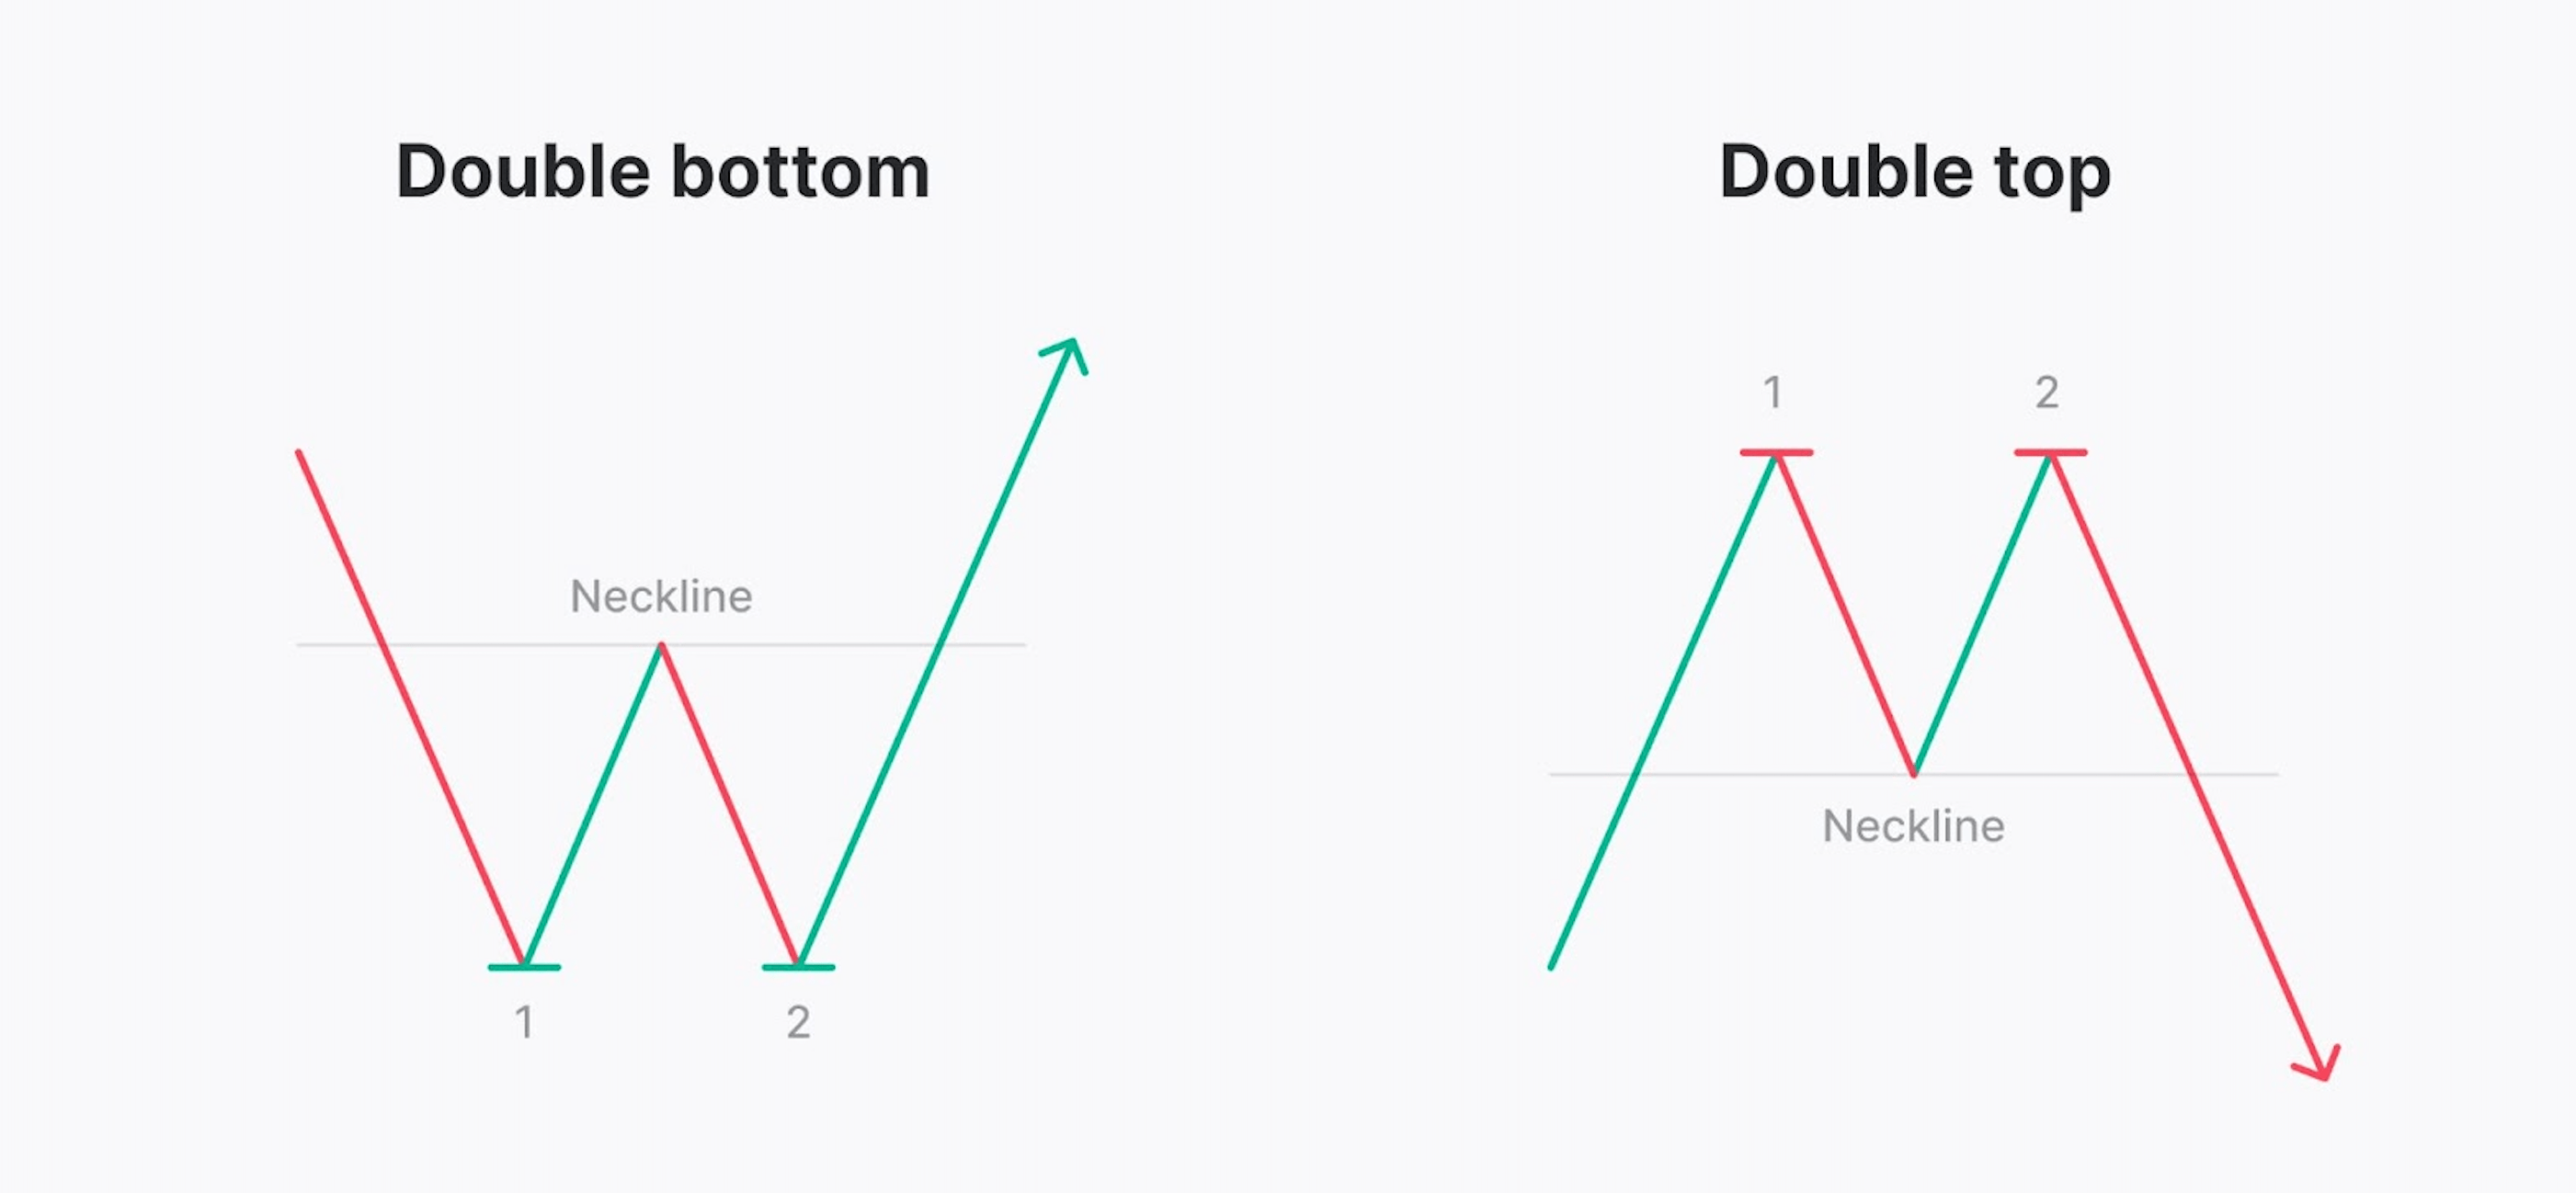
double top forms after a sustained uptrend. The price reaches a high, pulls back, then makes a second attempt to breach that high. When the second peak fails and the price drops below a key support level—called the neckline, which often signals the beginning of a downtrend.
Conversely, a
double bottom appears after a downtrend. The asset hits a low, bounces up, then retests the same low. If it fails to break lower and climbs above the neckline resistance, this often indicates a bullish reversal.
Volume often plays a confirming role. In a double top, volume typically weakens on the second peak, while in a double bottom, volume increases on the breakout, supporting the move.
These patterns are straightforward but powerful, offering a visual cue that market sentiment may be shifting.
Double Top Pattern
A double top resembles an “
M” shape on a chart. The pattern starts with a strong upward trend that peaks and then retreats slightly. The second peak reaches a similar level as the first but fails to break higher. Once the price falls below the
neckline: the support level formed between the two highs—the pattern is confirmed.
Key components:
Double Bottom Pattern
A double bottom looks like a “W.” It begins with a downward trend, bottoming out at a support level. After a brief rally, the price dips again to a similar low. If it then climbs above the neckline, which means the resistance between the two lows, and then a bullish reversal is confirmed.
Key components:
Why These Patterns Matter in Crypto
In the fast-moving world of crypto trading, where prices can swing dramatically within hours, spotting potential reversals early is crucial. This is where double tops and bottoms prove their value.
These patterns are rooted in market psychology. A double top signal that buyers have tried and failed twice to push the price higher, indicating weakening momentum and a likely shift toward selling pressure. A double bottom reflects a similar scenario in reverse: sellers exhaust their strength after testing a support level twice, opening the door for buyers to take control.
Because they form from repeated price action at key levels, double tops and bottoms are easier to recognize than more complex patterns. Their simplicity makes them especially useful for traders who are new to technical analysis but want reliable signals they can act on.
In a highly volatile market like crypto, these reversal formations can provide clear trade setups with defined risk and reward parameters: an essential advantage in unpredictable conditions.
How to Trade Double Tops and Bottoms
Recognizing
double tops and bottoms is just the first step—knowing how to trade them effectively is what makes the difference. Here’s a practical guide to using these patterns in your crypto trading.
1. Identify the Trend
Start by confirming the existing trend. A double top should follow a clear uptrend, while a double bottom should form after a sustained downtrend.
2. Spot the Pattern
Watch for two peaks (double top) or two troughs (double bottom) that are roughly equal in price. The space between them should include a pullback or bounce, forming the neckline.
3. Wait for Confirmation
The most common mistake is entering too early. Wait until the price
breaks through the neckline. This breakout confirms the pattern and suggests a trend reversal.
4. Set Entry, Stop-Loss, and Take-Profit
-
Entry: Just beyond the neckline after a confirmed breakout.
-
Stop-loss: Slightly above the second peak (double top) or below the second trough (double bottom).
-
Take-profit: Measure the height from the peaks (or troughs) to the neckline and project that distance beyond the breakout point.
5. Check Volume
Volume helps validate the move. Ideally, breakout moves should be supported by increased volume, adding credibility to the pattern.
By sticking to these rules, traders can use double tops and bottoms to develop strategies with defined risks and potential returns: an essential skill in volatile crypto markets.
Tips and Pitfalls
Trading
double tops and bottoms can be rewarding, but like any strategy, it requires careful attention to detail. Here are a few important tips—and common pitfalls to avoid:
Tips for Success
-
Wait for confirmation: Never enter a trade based on the pattern shape alone. Only act once the neckline is clearly broken.
-
Use volume as a filter: Look for volume increase during the breakout. It adds credibility to the move.
-
Stick to clear patterns: The two peaks or troughs should be similar in height and have some spacing between them. Patterns that are too tight or lopsided are less reliable.
-
Combine tools: Use indicators like RSI, MACD, or Moving Averages to confirm the signal from the pattern.
Pitfalls to Avoid
-
Jumping in early: Premature entries before confirmation can lead to false breakouts.
-
Ignoring trend context: Double tops should follow uptrends; double bottoms should follow downtrends.
-
Over-relying on shape: A pattern might look like a double top/bottom but fail due to broader market conditions.
Being patient and disciplined with these setups increases your odds of success significantly.
Practice with Real Charts
The best way to reinforce your understanding of double tops and bottoms is to practice identifying them on historical price charts.
How to Start Practicing:
-
Use platforms like
TradingView or
CoinCatch Advanced Charts.
-
Look at past Bitcoin and Ethereum price movements across different timeframes (e.g., 1H, 4H, daily).
-
Draw horizontal lines to mark necklines and try to spot clear double top or bottom patterns.
-
Simulate entries, stops, and profit targets—then track how those trades would have played out.
Chart pattern recognition is a skill, and repetition is key. Practicing regularly will sharpen your eyes and give you more confidence in live trades.
Conclusion: Pattern Recognition Is Power
Double tops and bottoms are reliable tools for identifying potential reversals in crypto markets. Their simplicity makes them ideal for traders new to technical analysis, and their structure provides a clear framework for planning entries and exits.
By learning to recognize these patterns, confirm them with volume and context, and execute disciplined trades, you’ll build the foundation for smarter, more strategic trading. Whether it’s Bitcoin, Ethereum, or any other digital asset, mastering this pattern can help turn chaos into clarity on your charts.
CoinCatch Team
Disclaimer:
Digital asset prices carry high market risk and price volatility. You should carefully consider your investment experience, financial situation, investment objectives, and risk tolerance. CoinCatch is not responsible for any losses that may occur. This article should not be considered financial advice.